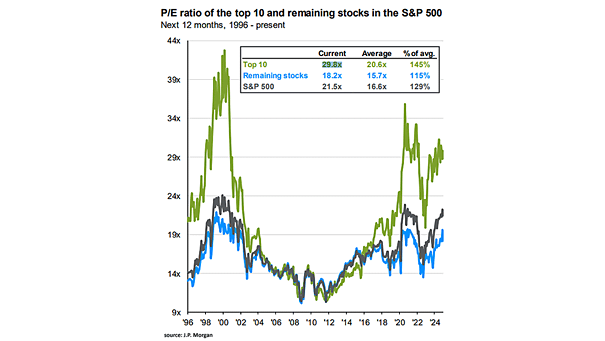
Valuation – P/E Ratio of the Top 10 and Remaining Stocks in the S&P 500

Valuation – P/E Ratio of the Top 10 and Remaining Stocks in the S&P 500 Investor concerns regarding the high valuation of the S&P 500 and its top 10 stocks are growing, particularly as historical data suggests that elevated valuations can lead to subpar performance. Image: J.P. Morgan Asset Management
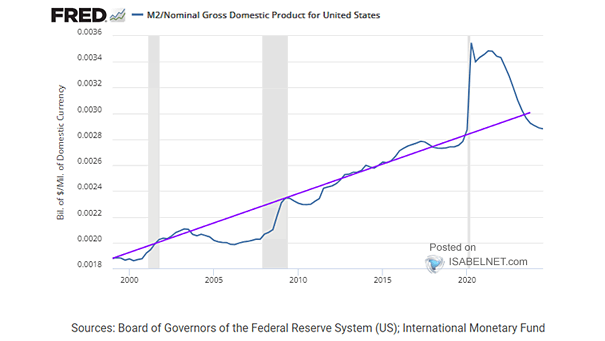
U.S. M2 to Nominal GDP Ratio

U.S. M2 to Nominal GDP Ratio The return of the U.S. M2 to nominal GDP ratio to its long-term trend is a positive indicator. It reflects a healthier balance between money supply and economic output, fostering stability and sustainable growth in the economy. Image: Federal Reserve Bank of St. Louis

S&P 500 Forward P/E Ratios and Subsequent 10-Year Returns

Forward P/E Ratio and Subsequent 5-Year Annualized Returns Current high valuations in the U.S. stock market indicate that investors may face lackluster returns over the next decade, leaving them feeling like a cat stuck in a tree—confused, anxious, and hoping for a miracle! Image: J.P. Morgan Asset Management

U.S. Debt to GDP Ratio

U.S. Debt to GDP Ratio The projected surge in U.S. federal debt over the next three decades may adversely impact the economy, resulting in elevated interest payments, strained resources, and possible constraints on economic growth and government flexibility. Image: Deutsche Bank

U.S. Stock Market Valuations – Combined P/E Ratio

U.S. Stock Market Valuations – Combined P/E Ratio High P/E ratios in U.S. tech stocks reflect both their potentially high valuations and investors’ overly optimistic dreams of future growth. Image: Topdown Charts

Sentiment – U.S. Composite Put/Call Ratio

Sentiment – U.S. Composite Put/Call Ratio The sharp decline in the U.S. put/call ratio to very low levels signals widespread market complacency, as even typically anxious investors appear unworried. Image: Morgan Stanley Wealth Management

ETF Assets Leveraged Long/Short Products Ratio

ETF Assets Leveraged Long/Short Products Ratio With leveraged long ETFs leaving inverse products in the dust, market’s optimism is so contagious that bears are considering a career change! Image: Bloomberg

Valuation – S&P 500 Price-to-Book Ratio

Valuation – S&P 500 Price-to-Book Ratio Fueled by AI optimism, the S&P 500’s price-to-book ratio hit 5.3 in 2024, proving that Wall Street can party like it’s 1999… again. Image: Bloomberg

Stock Market Concentration and Volatility

Stock Market Concentration and Volatility When equity markets become concentrated, they get a little too excited—like kids in a candy store! Image: Goldman Sachs Global Investment Research

Valuation – Shiller Cyclically Adjusted Price/Earnings Ratio

Valuation – Shiller Cyclically Adjusted Price/Earnings Ratio U.S. equity valuations have benefited from structural tailwinds but have recently overshot, leading to concerns about overvaluation, particularly in large-cap and growth stocks. Image: Goldman Sachs Global Investment Research

S&P 500 Ratio to Stoxx 600

S&P 500 Ratio to Stoxx 600 The S&P 500’s performance relative to the Stoxx 600 has hit the upper limit of its long-term channel. While U.S. equities may continue to lead due to strong growth potential, economic shifts could alter this trend. Image: Deutsche Bank