Market Sentiment Indicator

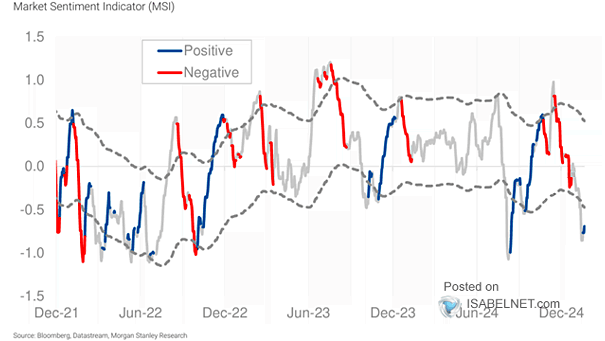
Market Sentiment Indicator Morgan Stanley’s current market sentiment indicator reflects a risk-positive outlook, suggesting that investors are optimistic about the market’s future performance. Image: Morgan Stanley Research
Sentiment – Risk Appetite and Expected U.S. Equity Market Performance

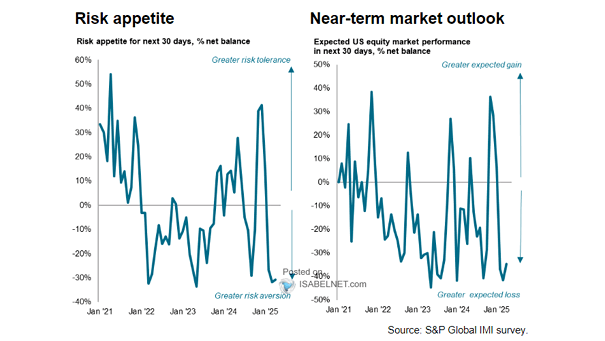
Sentiment – Risk Appetite and Expected U.S. Equity Market Performance In November, U.S. equity investors’ risk appetite surged to its highest level in nearly four years, reflecting a significant shift in sentiment as political uncertainties eased and the U.S. macroeconomic outlook improved. Image: S&P Global Market Intelligence

Sentiment – Global Equity Risk-Love

Sentiment – Global Equity Risk-Love The Global Equity Risk-Love indicator, currently at the 68th percentile, has moved out of the euphoria territory, allowing for potential upside as we approach year-end. Image: BofA Predictive Analytics

Sentiment – Net Bullish Ratio vs. S&P 500 Index

Net Bullish Sentiment vs. S&P 500 Index The net difference between bulls and bears indicates overall investor sentiment and suggests a temporary pullback within a bullish market trend. Image: Real Investment Advice

Sentiment – 5-Day U.S. Put/Call Ratio Composite

Sentiment – 5-Day U.S. Put/Call Ratio Composite The rise in the 5-day put/call ratio indicates a shift from complacent levels, but the dominance of call volume suggests that the rise may not be climactic. While the market is becoming more cautious, it is not yet in panic mode. Image: BofA Global Research

Sentiment – Global Risk Demand Index

Sentiment – Global Risk Demand Index The Morgan Stanley Global Risk Demand Index indicates that investors’ risk appetite is very low, which can often be seen as a contrarian indicator, where extreme pessimism might signal a potential rebound in equity markets. Image: Morgan Stanley

Combined AAII & II Sentiment

Combined AAII & II Sentiment The combined sentiment of the American Association of Individual Investors (AAII) and Investors Intelligence (II) continues to be bullish, with bearish sentiment remaining notably low. Image: Topdown Charts

Sentiment Scores During Earnings Calls

Sentiment Scores During Earnings Calls In recent quarters, falling inflation and the prospect of lower interest rates have had a positive impact on U.S. corporate sentiment, which is seen as a favorable sign for the U.S. economy. Image: BofA US Equity & Quant Strategy

Sentiment – U.S. Put Call Ratio Composite

Sentiment – U.S. Put Call Ratio Composite A relatively low put/call ratio is often interpreted as a sign of heightened bullish sentiment or greed in the market, which is frequently viewed as a contrarian indicator. Image: The Daily Shot

Sentiment/VIX Composite vs. S&P 500

Sentiment/VIX Composite vs. S&P 500 Current levels of the Sentiment/VIX Composite Index are more indicative of near-term market peaks than the beginning of a bullish trend. Image: Real Investment Advice

AAII U.S. Investor Sentiment Bearish Readings

AAII U.S. Investor Sentiment Bearish Readings The AAII Bearish Sentiment continues to be below its historical average, suggesting that AAII investors hold an optimistic view of the short-term stock market outlook. Image: The Daily Shot