S&P 500 McClellan Oscillator

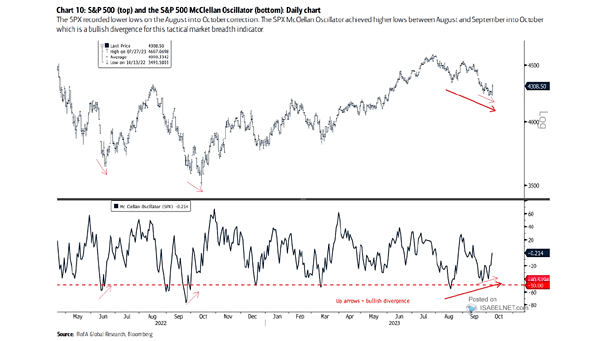
S&P 500 McClellan Oscillator The bullish divergence in the S&P 500 McClellan oscillator implies underlying buying pressure, signaling positivity for U.S. stocks and increasing the likelihood of a market reversal or bounce back. Image: BofA Global Research
S&P 500 Index vs. 200 and 40-Week Moving Averages

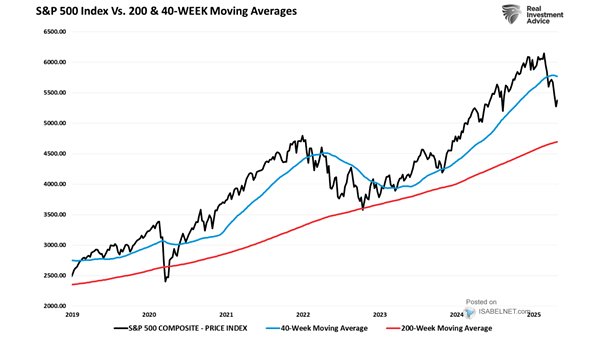
S&P 500 Index vs. 200 and 40-Week Moving Averages When the S&P 500 index is trading above the rising 40-week moving average, this may indicate a bullish outlook for the market. Image: Real Investment Advice

Weekly S&P 500 GICS Level 1 Sector Breadth

Weekly S&P 500 GICS Level 1 Sector Breadth This bullish chart shows that the S&P 500 GICs level 1 sector breadth moved above five, confirming the 2020 market rally. Image: BofA Global Research

Equity Flows vs. Equity Return

Equity Flows vs. Equity Return Goldman Sachs is mildly bullish, suggesting that the demand for equity from funds could increase this year and support the stock market. Image: Goldman Sachs Global Investment Research

U.S. Equity Indices Futures

U.S. Equity Indices Futures The U.S. stock market is on fire. Investors have grown extremely bullish. Image: BCA Research