S&P 500 and Leveraged Long vs. Short ETF Volumes
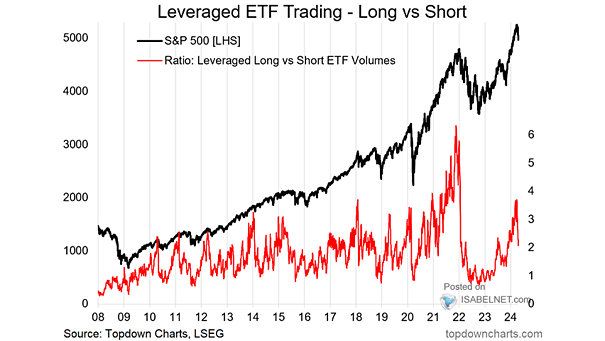
S&P 500 and Leveraged Long vs. Short ETF Volumes The degree of activity in leveraged long vs. short U.S. equity ETFs has experienced a substantial decline as sentiment shifts. Image: Topdown Charts
S&P 500 and Leveraged Long vs. Short ETF Volumes The degree of activity in leveraged long vs. short U.S. equity ETFs has experienced a substantial decline as sentiment shifts. Image: Topdown Charts
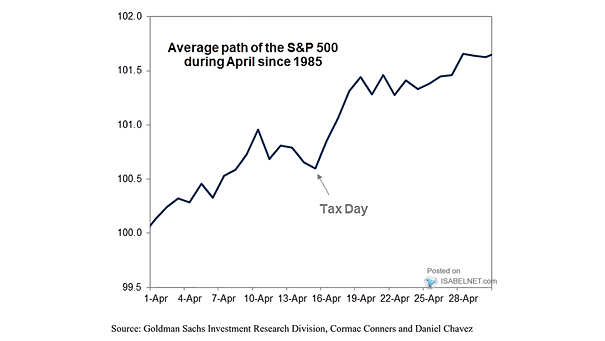
Average Path of the S&P 500 During April April has historically been a month of positive trends in the U.S. stock market, suggesting favorable sentiment and growth potential. Image: Goldman Sachs Global Investment Research

IG + HY Bond Fund Flows Despite the potential risks associated with investing in IG and HY bond funds, continued strong inflows to these funds indicate a positive sentiment among investors. Image: BofA Global Investment Strategy
S&P 500 Equal Weight Index The performance of the S&P 500 Equal Weight Index continues to be influenced by factors such as economic conditions, market sentiment, and other macroeconomic indicators. Image: Morgan Stanley Research
S&P 500 Composite in Elections Years and Election Years When >10% Gains in Previous Year Given the Fed’s interest rate projections, market sentiment indicators and historical market behavior, investors may reasonably expect the S&P 500 index to reach new highs soon. Image: Fundstrat Global Advisors, LLC
Cumulative Global Fund Flows Investors are showing less enthusiasm for equity funds. In contrast, flows into global bond and cash funds remain very strong, reflecting a prevailing investor sentiment towards these two asset classes. Image: Goldman Sachs Global Investment Research
VIX and Geopolitical Risk Index The VIX tends to be sensitive to geopolitical events and can serve as an indicator of market sentiment during times of heightened geopolitical risk. Image: Goldman Sachs Global Investment Research
S&P 500 Earnings Revisions Breadth Earnings revisions breadth for both large and small caps has returned to negative territory, which means that the overall sentiment and expectations for future earnings have worsened. Image: Morgan Stanley Research
Weighted Average Price Target for S&P 500 Companies Goldman Sachs price targets imply a +19.3% return over the next 12 months, which suggests a bullish sentiment and very optimistic outlook. Image: Goldman Sachs Global Investment Research
Valuation – MSCI U.S. 12-Month Forward P/E Relative to MSCI World Ex. U.S. There is a prevailing sentiment suggesting that U.S. equity valuations are not currently appealing. Image: J.P. Morgan
AAII Survey – Average S&P 500 Returns After % of Bullish Investors Dropped Below 20% The AAII Bullish Sentiment is below 20%, which is contrarian bullish. Image: Truist