S&P 500 Net Debt vs. Share Buybacks
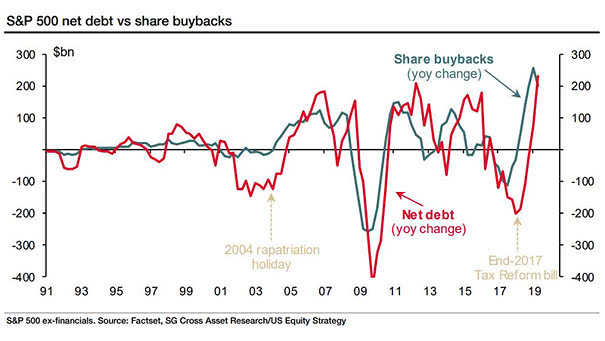
S&P 500 Net Debt vs. Share Buybacks U.S. companies are ramping up share buybacks. Funding is coming in part from a rise in debt. Image: Societe Generale Cross Asset Research
S&P 500 Net Debt vs. Share Buybacks U.S. companies are ramping up share buybacks. Funding is coming in part from a rise in debt. Image: Societe Generale Cross Asset Research
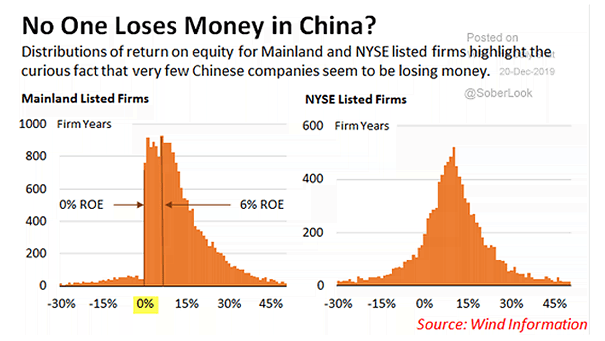
No One Loses Money in China? That’s pretty curious. Very few Chinese companies appear to have a negative return on equity (ROE) compared to NYSE listed firms. Image: Wind Information

State and Private Enterprise Default Rate in China The default rate for private Chinese companies has reached a record high at 4.9% vs. 0.6% in 2014. Image: Financial Times
Average Age of U.S. Private Fixed Assets Since the Great Financial Crisis, America’s equipment is getting older. Companies have been reluctant to invest and that’s not good news for the U.S. economy. Image: Deutsche Bank Global Research
Job Creation by Size of Company in the U.S. Large companies are becoming less important, when it comes to job creation in the United States. Image: Bianco Research
U.S. Corporate Bond Ownership More than 25% of U.S. corporate bonds are held by insurance companies. Many investment grade investors are not allowed to hold junk-rated bonds. Any drop in the credit ratings could amplify the next recession. Image: NBF Economics and Strategy
Japan Stock Market Japan holds more than 4% of the domestic stock market, making the BoJ the top shareholder of more than 55 companies in the Nikkei 225. Image: Macrobond Financial
Forward P/E of S&P 500 Top and Bottom Valuation Quintiles The forward P/E of the top quintile of S&P 500 companies by valuation is 27 (avg: 20) vs. 11 (avg: 10) for the lowest quintile. Image: Goldman Sachs Global Investment Research
Buybacks and Dividends as Percentage of Market Capitalization Amid gloomy earnings, U.S. companies are increasingly using debt to fund buybacks and dividends. Image: Institute of International Finance
U.S. Non-Financial Corporate Debt and Net Share Repurchases (Buybacks) Thanks to low interest rates, U.S. companies are increasingly using debt to buy back shares. Image: BofA Merrill Lynch Global Research
U.S. Corporate Debt Maturity Wall This chart shows the massive wave of maturities faced by investment-grade and speculative-grade U.S. companies in coming years. Image: Oxford Economics