Real S&P 500 Index and Periods to Breakeven

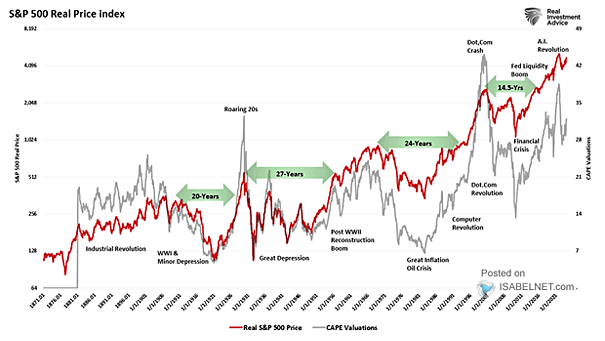
Real S&P 500 Index and Periods to Breakeven The timing of your investment journey can significantly impact your future outcomes, and even with the Fed’s interventions, recovering from a bear market can take a considerable amount of time. Image: Real Investment Advice
Weekly Equity Fund Flows

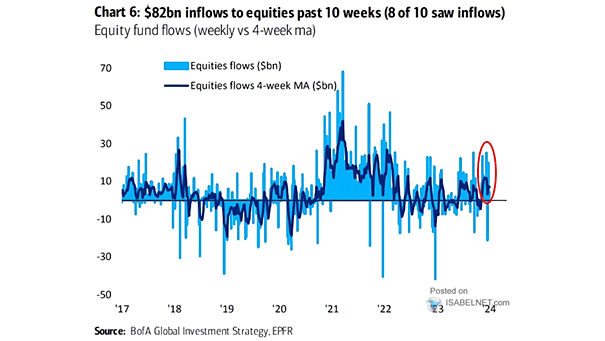
Weekly Equity Fund Flows Equity funds seeing $82 billion inflows over the past 10 weeks indicates the strong confidence investors have in the potential returns in equity markets. Image: BofA Global Investment Strategy

Real S&P 500 and Real GDP

Real S&P 500 and Real GDP The excesses of the U.S. stock market tend to correct themselves over time. Image: Real Investment Advice

Correlation Between S&P 500 Index and MSCI EAFE Index

Correlation Between S&P 500 Index and MSCI EAFE Index Since 1997, the high correlation between U.S. and international equity markets suggests that the MSCI EAFE may only offer a slight risk/return benefit as a complement to a U.S. equity portfolio. Image: First Eagle Investment Management, LLC

U.S. Equities and The World: Earnings Growth vs. Multiple Expansion

U.S. Equities and The World: Earnings Growth vs. Multiple Expansion Since the 2009 low, the strong performance of the U.S. markets comes from earnings growth (73%) and multiple expansion (27%). You may also like “S&P 500 Return: Earnings Growth vs. Multiple Expansion.” Image: Goldman Sachs Global Investment Research

Dow Jones Transportation Average vs. S&P 500

Dow Jones Transportation Average vs. S&P 500 This interesting chart suggests that the Dow Jones Transportation Average underperforms in secular bull markets. Actually, the S&P 500 had higher returns when the Dow Jones Transportation Average experienced negative momentum. Image: Oppenheimer & Co.