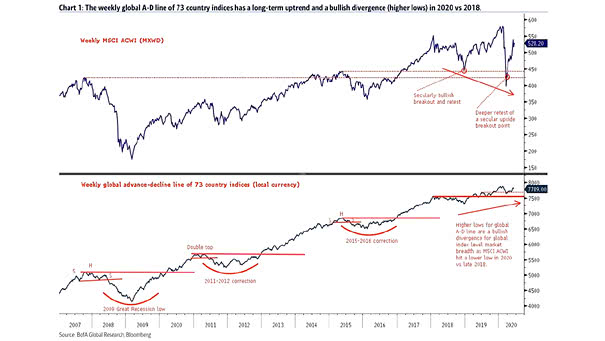
G4 GDP Forecast

G4 GDP Forecast Deutsche Bank expects G4 GDP levels to remain well below the pre-crisis trend. Image: Deutsche Bank Asset Allocation

Inflation-Adjusted Investment in U.S. Stock Market

Inflation-Adjusted Investment in U.S. Stock Market This chart puts into perspective the long-term trend of the S&P 500 Total Return adjusted for CPI inflation (real CAGR = 6.7%). Image: Hondo Tomasz

Delinquency Rate on All Loans and Recessions

Delinquency Rate on All Loans and Recessions In recent history, the delinquency rate trended upward before the recession began. Today, it is declining and does not suggest a recession is looming.

U.S. and Europe: Value vs. Growth Price to Book Ratio

U.S. and Europe: Value vs. Growth Price to Book Ratio Valuations for growth vs. value are back near the levels that preceded 2000-01, but the trend is still intact for the time being. Image: Morgan Stanley Research

Earnings, Dividends and Valuation

Earnings, Dividends and Valuation Chart showing the deviation of the S&P 500 Index against its trend line. The U.S. stock market needs earnings growth to rise this year. Image: Fidelity Investments

Global Equities: Value vs. Growth Price to Book Ratio

Global Equities: Value vs. Growth Price to Book Ratio Chart suggesting that value is extremely cheap vs. growth across regions, but the trend is still intact for the time being. Image: Morgan Stanley Research

U.S. Consumer Credit

U.S. Consumer Credit The current downtrend in US consumer credit impulse could suggest a scenario of slowing growth this year. Image: Macrobond Financial

China-US Trade as % of Chinese GDP

China-US Trade as % of Chinese GDP The downtrend in China-US trade will be hard to reverse, even with the “phase one” trade deal. Image: Financial Times

Chicago Fed National Activity Index and Recessions

Chicago Fed National Activity Index and Recessions The Chicago Fed National Activity Index fall to -0.35 in December, and stayed at a negative reading. Anything negative is below-average growth. In recent history, anything at or below -0.7 (red line) was equivalent to a recession. “A zero value for the index indicates that the national economy is expanding…

Valuation – S&P 500 vs. 10-Year Treasury Bond

Valuation – S&P 500 vs. 10-Year Treasury Bond This chart suggests that there is a 2 in 3 chance of a trend reversal, as the S&P 500 looks overbought vs. the 10-year Treasury bond. Image: BCA Research