S&P 500 vs. IPO Performance
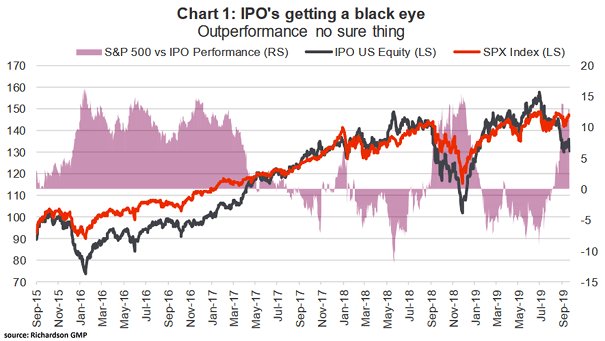
S&P 500 vs. IPO Performance The chart shows how IPOs have performed since 2015. Currently, investors seem reluctant to invest in high-risk, high-growth companies. Image: Richardson Wealth
S&P 500 vs. IPO Performance The chart shows how IPOs have performed since 2015. Currently, investors seem reluctant to invest in high-risk, high-growth companies. Image: Richardson Wealth
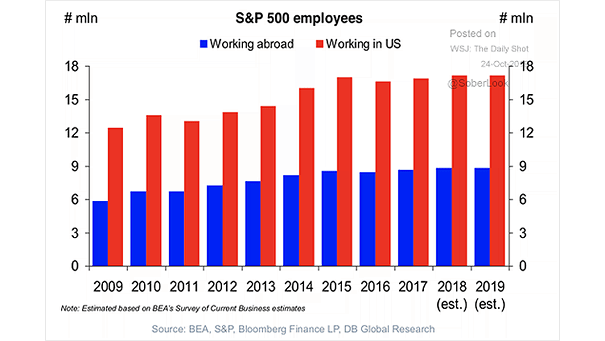
S&P 500 Employees Why S&P 500 companies aren’t so American? A large portion of S&P 500 employees works abroad. Image: Deutsche Bank Global Research

Cumulative S&P 500 Buybacks 2009-2019 Are buybacks driving the show? Thanks to tax cuts and low interest rates, corporate stock buybacks are booming. Over the past decade, S&P 500 companies bought back $5 trillion shares, while cumulative flows from households and foreigners are only a drop in the bucket. But what would happend if companies reinvested instead…
Shareholder Return vs. Free Cash Flow Thanks to low interest rates, shareholder return has exceeded free cash flow levels again. U.S. companies cannot spend more than they earn indefinitely. Image: Goldman Sachs Global Investment Research
Dividends and Buybacks vs. Free Cash Flow Dividends and buybacks have exceeded free cash flow levels again, thanks to low interest rates. But companies cannot spend more than they earn forever. Image: Capital Group
U.S. Market Shares in China U.S. companies are clearly losing market share in key sectors in China, while President Trump wants American companies to leave China. Image: Oxford Economics
S&P 500 Earnings and U.S. Capital Spending This chart shows that U.S. core capital spending is near a 20-year high. Are fears that U.S. companies may be curtailing spending plans overblown? The absence of dividend cuts also suggests that U.S. companies are confident in their future earnings potential. Image: The Leuthold Group
Global Corporate Bond Sales Companies sold a record amount of bonds in September. Yield-seeking investors were served up $434bn of new corporate bonds globally. Image: Financial Times
China’s Global Acquisitions Global acquisitions by Chinese companies continue to fall, due to tight credit conditions and US-China trade tensions. Image: Financial Times
Share Buybacks in China Chinese companies are buying back record amounts of stocks. Image: Goldman Sachs Global Investment Research
Dividend Yield vs. Corporate Bond Yield This chart shows that dividend yields of European companies appear more attractive than corporate bond yields. Image: Goldman Sachs Global Investment Research