Impact of an Inverted Yield Curve: S&P 500 and U.S. Dollar

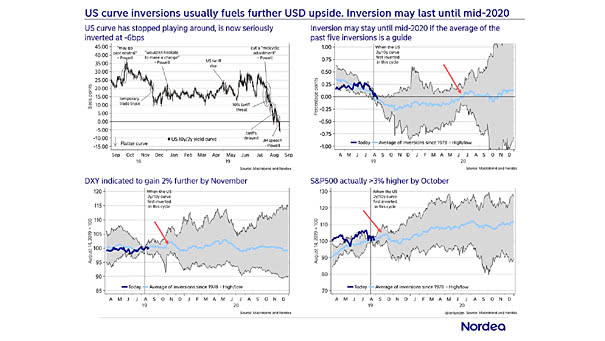
Impact of an Inverted Yield Curve: S&P 500 and U.S. Dollar History tells us that the U.S. dollar and the S&P 500 could go higher, and the yield curve could stay inverted until mid-2020. Image: Nordea and Macrobond Click the Image to Enlarge
Strong Dollar and Imports

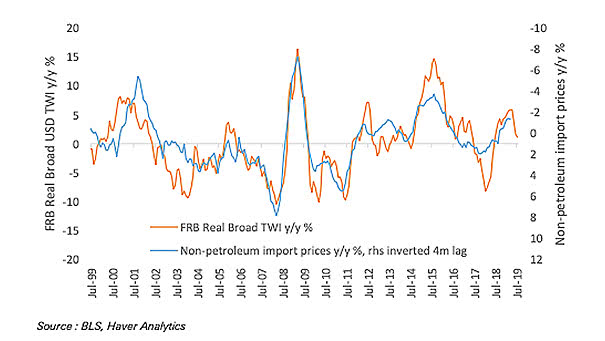
Strong Dollar and Imports The chart shows that a stronger dollar depresses goods prices via imports. Image: Deutsche Bank Global Research

U.S. Recession Probability and the U.S. Dollar

U.S. Recession Probability and the U.S. Dollar The chart shows the correlation between the NY Fed probability of U.S. recession and the U.S. dollar. Image: BofA Merrill Lynch

U.S. Dollar and Weak Global Growth

U.S. Dollar and Weak Global Growth This spreadsheet shows that Fed policy easing can weaken the U.S. dollar in times of weak global growth. Image: Goldman Sachs Global Investment Research

U.S. Budget Deficits and the U.S. Dollar

U.S. Budget Deficits and the U.S. Dollar Pretty good correlation between U.S. budget deficits and the U.S. dollar over the past 30 years. The chart suggests that the U.S. dollar should weaken over time. You may also like “U.S. Twin Deficits (% of GDP) Lead Real Trade Weighted Dollar Index by Two Years” and “U.S. Dollar…

U.S. Twin Deficits (% of GDP) Lead the U.S. Dollar Broad REER by 18 Months

U.S. Twin Deficits (% of GDP) Lead the U.S. Dollar Broad REER by 18 Months The chart suggests that the U.S. dollar should weaken over time. You may also like “U.S. Twin Deficits (% of GDP) Lead Real Trade Weighted Dollar Index by Two Years” and “U.S. Dollar and Relative Growth (GDP Spread)” and “U.S. Budget…

U.S. Dollar and Relative Growth (GDP Spread)

U.S. Dollar and Relative Growth (GDP Spread) The chart shows that the U.S. Dollar REER is about relative growth (U.S. GDP – Other Developed Market GDP YoY). You may also like “U.S. Twin Deficits (% of GDP) Lead Real Trade Weighted Dollar Index by Two Years” and “U.S. Twin Deficits (% of GDP) Lead U.S.…

Dollar Index vs. MSCI Emerging Markets Relative Performance

Dollar Index vs. MSCI Emerging Markets Relative Performance Interesting chart showing the correlation of -0.89. Emerging markets could soar if the U.S. dollar falls. You may also like “Twin Deficits (% of GDP) Lead Real Trade Weighted Dollar Index by Two Years.” Image: Paolo Cardena