Flows for the Broad U.S. Asset Classes: Stocks and Bonds
Flows for the Broad U.S. Asset Classes: Stocks and Bonds During the week ending December 25th, U.S. ETFs and equity funds had the largest weekly outflow YTD. Image: BofA Global Research
Flows for the Broad U.S. Asset Classes: Stocks and Bonds During the week ending December 25th, U.S. ETFs and equity funds had the largest weekly outflow YTD. Image: BofA Global Research
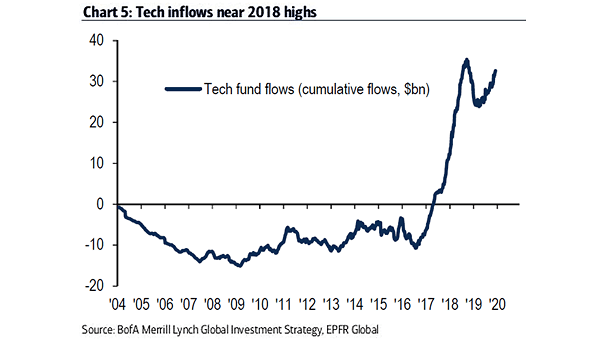
Tech Fund Flows Are tech fund inflows indicating a potential bubble? Image: BofA Merrill Lynch Global Investment Strategy

Inflows to Emerging Market Equity Funds Investors are back into emerging markets equities. This is the biggest 4-week inflows to emerging market equity funds since January 2019. Image: BofA Merrill Lynch Global Research
Money Market Fund Flows and Probability of a Recession in the Next 12 Months Chart suggesting that the probability of a recession in the next 12 months has decreased. Image: Goldman Sachs Global Investment Research
Gold and Silver Weekly Fund Flows This is the biggest outflows from gold since December 2016, as a more positive global outlook drives optimism. Image: BofA Merrill Lynch Global Investment Strategy
Gold Funds Weekly Flows Chart showing that gold funds have not yet seen any meaningful outflows. Image: Deutsche Bank Global Research
Fed and Flow of Funds Annual U.S. Treasury Purchases by Sector In 2020, the Fed is expected to buy more than $510 billion in U.S. Treasuries. Image: Goldman Sachs Global Investment Research
U.S. Equity Fund Flows vs. Bonds and Cash This chart puts into perspective the rotation from equities to bonds and cash, as investors become cautious about further growth. Image: Goldman Sachs Global Investment Research
U.S. Fund Flows Chart showing the large divergence between flows into equity funds and those into cash and bonds. Image: Goldman Sachs Global Investment Research
Shareholder Return vs. Free Cash Flow Thanks to low interest rates, shareholder return has exceeded free cash flow levels again. U.S. companies cannot spend more than they earn indefinitely. Image: Goldman Sachs Global Investment Research