Dow Jones Transportation Average vs. S&P 500

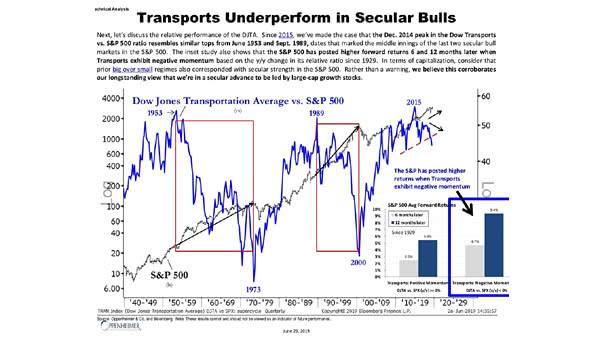
Dow Jones Transportation Average vs. S&P 500 This interesting chart suggests that the Dow Jones Transportation Average underperforms in secular bull markets. Actually, the S&P 500 had higher returns when the Dow Jones Transportation Average experienced negative momentum. Image: Oppenheimer & Co.
Dow Jones Index since 1896

Dow Jones Index since 1896 This great chart shows the Dow Jones Industrial Average Index since 1896 and lengthy periods of time with zero returns (dividends are not included). That’s the reason why we develop stock market forecasting models. Image: Mohnish Pabrai

Estimated Number of Hedge Funds Launched or Closed since 2008

Estimated Number of Hedge Funds Launched or Closed since 2008 Can hedge funds deliver higher returns than passive investing? Not really. But many investors still think they can achieve higher returns with active trading than with passive investing. The chart below shows that it is really hard to outperform the market. As Warren Buffett said,…

Gold Has Crushed the S&P 500 So Far Since 2000

Gold Has Crushed the S&P 500 So Far Since 2000 Gold has returned a great 345.30 percent, while the S&P 500 has returned 146.57 percent since 2000. Keep in mind that Gold has beaten the US stock market over multiple time periods Historically, Gold has also had a strong negative correlation with the US stock…