% of S&P 500 Capitalization
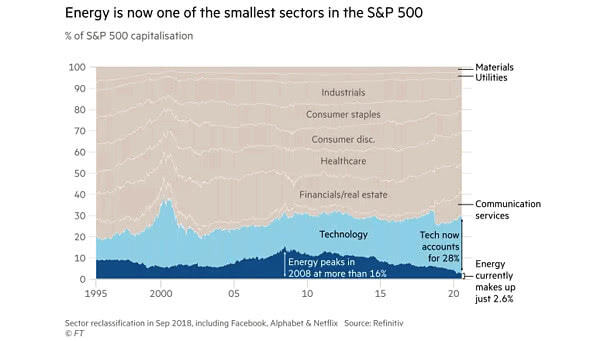
% of S&P 500 Capitalization Currently, the energy sector accounts for only 2.6% of the S&P 500’s capitalization, while tech now accounts for 28%. Image: Financial Times
% of S&P 500 Capitalization Currently, the energy sector accounts for only 2.6% of the S&P 500’s capitalization, while tech now accounts for 28%. Image: Financial Times
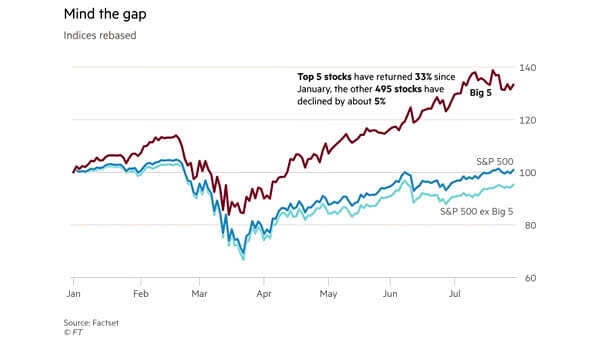
S&P 500 vs. Top 5 Stocks Does big tech present a risk for investors? Image: Financial Times

Top 25 Members of the S&P 500 Another tech bubble? This table shows the 25 largest stocks in 1973, 2000 and 2020. Back in 1973, IBM was 12.74% of the market capitalization. Image: Fidelity Investments
EU27 Nominal GDP vs. Nasdaq Market Capitalization Is tech in a bubble? The Nasdaq market capitalization is now bigger than the nominal GDP (in U.S. dollars) of the European Union’s 27 member countries. Image: Deutsche Bank
Berkshire Hathaway Annual Return Minus the Total Return of the S&P 500 Heavy on banks, but light on tech. Has Warren Buffett lost his mojo? Image: Financial Times
S&P 500 Sector Performance Since the March 23 Low Since the March 23 low, the best-performing sector has been energy, not tech. Image: Charles Schwab
S&P 500 vs. Russell 2000 The Russell 2000 has underperformed recently. Tech accounts for 25% of the S&P 500 vs. 15% of the Russell 2000. Image: Goldman Sachs Global Investment Research
The Five Biggest Stocks in the S&P 500 The five biggest tech stocks dominate the S&P 500 Index. Image: Ritholtz Wealth Management LLC
Digital Money and Confidence A majority of people across the world don’t trust big tech companies to issue digital money. Image: Financial Times
U.S. Equities and Global Equities ex-U.S. This chart suggests that higher yields could cause great rotation from bonds to stocks, US equities to non-US equities, growth to value, large caps to small caps, tech stocks to bank stocks, credit to commodities,… Image: BofA Global Investment Strategy
U.S. Jobs of the 2010s Jobs in tech, construction, home health and fitness center were among the fastest growing of the decade. Image: Reuters