Household Debt Service Ratios by Country
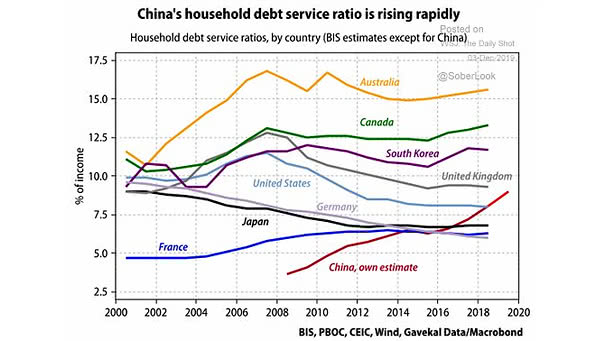
Household Debt Service Ratios by Country China’s household debt has grown rapidly in recent years. Image: Gavekal, Macrobond
Household Debt Service Ratios by Country China’s household debt has grown rapidly in recent years. Image: Gavekal, Macrobond
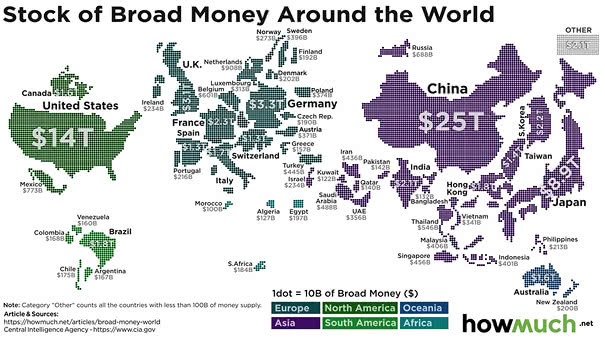
Stock of Broad Money Around the World This chart shows how much money is in circulation around the world. China has the most money in circulation, followed by the U.S.. Image: howmuch.net

U.S. Trade Deficit to GDP The chart shows that the U.S. trade deficit as percentage of gross domestic product is still huge, despite the US-China trade war. Image: BofA Merrill Lynch Global Research
Global Debt IIF expects the global debt load to exceed $255 trillion in 2019, largely driven by the United States and China. Image: Institute of International Finance
U.S. Core Capital Goods Shipment and Non-residential Business Fixed Investment (Capex) Is the “phase one” US-China trade deal enough to reverse the slowdown? Image: Deutsche Bank Global Research
Private Sector Debt Private sector debt is high in China, extremely high in Sweden, and continues to rise. Source: Gavekal
Liquidity Premium and IG Bonds The spread between low liquid and high liquid IG bonds is widening, despite the rally and the belief of an improvement in US-China trade tensions. Image: Goldman Sachs Global Investment Research
World Counting on the U.S. Consumer The U.S. consumer accounts for 17% of world GDP. That’s more than China’s GDP. Image: Truist
Total Carbon Emissions by Country (CO2) China, the United States, and India account for almost half of the total global carbon emissions. Image: Global Carbon Project
Projecting the Bull and Bear Market If a US-China trade deal is reached, this chart suggests a rally to the long-term bullish trend line at 3300. Image: Real Investment Advice