The Five Biggest Stocks in the S&P 500
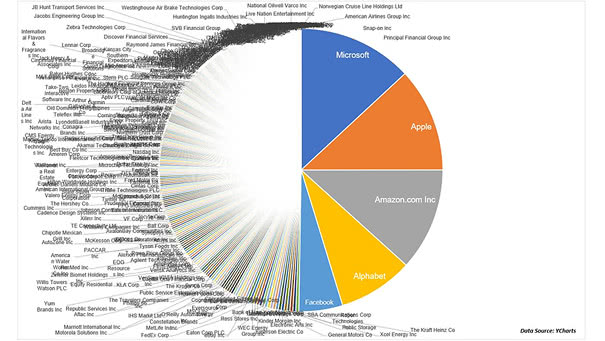
The Five Biggest Stocks in the S&P 500 The five biggest tech stocks dominate the S&P 500 Index. Image: Ritholtz Wealth Management LLC
The Five Biggest Stocks in the S&P 500 The five biggest tech stocks dominate the S&P 500 Index. Image: Ritholtz Wealth Management LLC
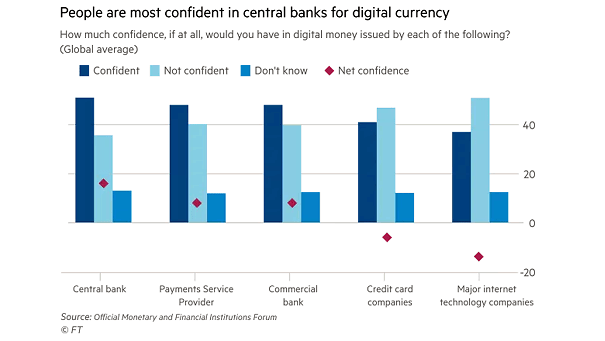
Digital Money and Confidence A majority of people across the world don’t trust big tech companies to issue digital money. Image: Financial Times

U.S. Equities and Global Equities ex-U.S. This chart suggests that higher yields could cause great rotation from bonds to stocks, US equities to non-US equities, growth to value, large caps to small caps, tech stocks to bank stocks, credit to commodities,… Image: BofA Global Investment Strategy
U.S. Jobs of the 2010s Jobs in tech, construction, home health and fitness center were among the fastest growing of the decade. Image: Reuters
S&P 500 Drawdowns Since 2009 Low This chart puts drawdowns into perspective. Since 2009 low, the S&P 500 hasn’t had a technical 20% drawdown. Image: Advisor Perspectives, Inc.
The Largest Industry Weighting of the Top Six Stocks in the S&P 500 The six FAANMG stocks account for 17.51% of the S&P 500. Are we seeing another tech bubble? Image: Bianco Research
High Yield CCC-Rated Bonds Consumer-related and technology industries now represent more than one-third of CCC issues. Image: Arbor Research & Trading LLC
Number of U.S. IPOs and U.S. IPOs with Negative Earnings This chart shows the fall in new listings and the proportion of unprofitable U.S. IPOs at the highest level since the tech bubble. Image: J.P. Morgan Asset Management
Fear & Greed Index vs. S&P 500 RSI Chart suggesting a good correlation between the Fear & Greed Index and the S&P 500’s RSI. Image : CNN and MacroTechnicals
Proportion of Unprofitable IPOs The proportion of unprofitable IPOs has reached 70%, the highest level since the tech bubble 20 years ago. Image: BofA Merrill Lynch