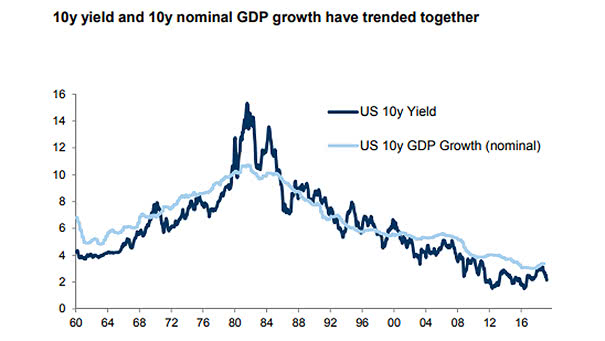
U.S. Core PCE vs. Fed Target

U.S. Core PCE vs. Fed Target The U.S. core personal consumption expenditures price index, which excludes food and energy, rises to 1.6% in June. Inflation trending back up toward the Fed’s 2% target is good news. You may also like “U.S. Core Inflation Expected Over the Next 21 Months.”

U.S. Labor Force vs. Inflation

U.S. Labor Force vs. Inflation The chart shows the enduring link between labor force and inflation. The chart also suggests that U.S. labor force leads U.S. CPI by three years. Demographic trends imply subdued inflation. You may also like “World Population & Demographics – More People Over 65 than Under 5 for the First Time.”…

S&P 500 vs. Cumulative Fund Flows

S&P 500 vs. Cumulative Fund Flows “History never repeats itself but it rhymes” said Mark Twain. This chart shows the same trend as for the 2016 period. Image: Topdown Charts

American Semiconductor Sales Lead ISM Manufacturing Index

American Semiconductor Sales Lead ISM Manufacturing Index by 3 Months This chart shows that the downtrend in American semiconductor sales is currently worrying. You may also like “ISM Manufacturing Index vs. S&P 500 Index since 2011.” Image: Deutsche Bank Global Research

Recession Indicator to Watch: Net Domestic Investment to GDP

Recession Indicator to Watch: Net Domestic Investment to GDP Net Domestic Investment to GDP is in a long-term downtrend since 1950. It is not a timing indicator for predicting the end of business cycles. But historicammy, before recessions, it tends to peak (red arrow) and then decline (black arrow). Currently, Net Domestic Investment to GDP has a…

Why the Fed Can’t Raise Interest Rates Above Inflation Rate, Today?

Why the Fed Can’t Raise Interest Rates Above Inflation Rate, Today? The Federal Reserve can’t raise the Fed funds rate above the inflation rate because the US productivity growth is too weak.Net Domestic Investment to GDP is in a long-term downtrend and reduces productivity.This makes it difficult to see the Fed funds rate exceed the…

Stock Market Bull and Bear Indicator

This powerful indicator looks into the US stock market and suggests whether it is bullish, bearish or neutral Using multiple financial data, this great model helps investors navigate through different market conditions. It suggests whether the US stock market tendency is bullish, bearish or neutral. It is a contrarian indicator. A bullish signal suggests that…

Stock Market Short-Term Forecast

https://www.isabelnet.com/wp-content/uploads/2019/03/stock-market-short-term-forecast.mp4 This great tool shows the US stock market forecast for the next 12 months and the probability This advanced mathematical model extracts insights from multiple financial data and suggests a stock market short-term forecast for the next 12 months with a very high degree of confidence. This great prediction model is updated daily, with…