U.S. Monetary Policy and Recession

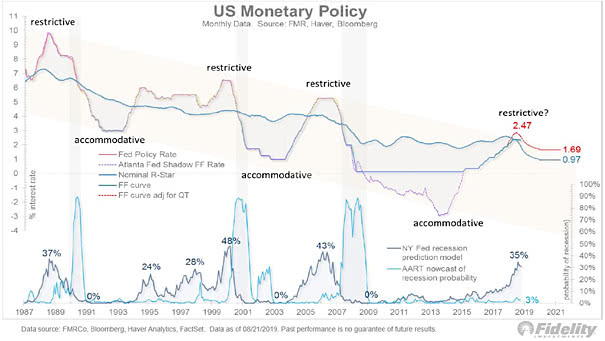
U.S. Monetary Policy and Recession This chart shows the U.S. monetary policy and two recession forecasting models over time (Fed policy rate, Atlanta Fed shadow Fed funds rate, nominal R-Star, Fed funds curve). Image: Fidelity Investments
A Hall of Mirrors in Monetary Policy?

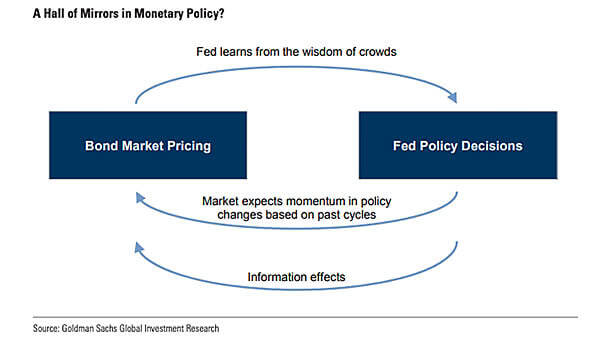
A Hall of Mirrors in Monetary Policy? This chart suggests a feedback loop between bond market pricing and central bank decisions. Image: Goldman Sachs Global Investment Research

Equity Risk Premium

Equity Risk Premium The equity risk premium (earnings yield less bond yield) stands at 4.48% (the 90th percentile since 1985). It suggests that equities are cheap relative to bonds. Image: Fidelity Investments

Does U.S. Productivity Increase Under Trump?

Does U.S. Productivity Increase Under President Trump? The answer is yes, because businesses have invested. Even if Net Domestic Investment to GDP is in a long-term downtrend, that’s good news for the U.S. economy. Keep in mind that it is a key factor in extending the business cycle. US Productivity has increased, because US companies have invested,…

U.S. Dollar and Weak Global Growth

U.S. Dollar and Weak Global Growth This spreadsheet shows that Fed policy easing can weaken the U.S. dollar in times of weak global growth. Image: Goldman Sachs Global Investment Research

The Fed vs. the 10-Year Treasury Yield

The Fed vs. the 10-Year Treasury Yield The Fed fund curve suggests that the 10-year Treasury yield could fall below its all-time low of 1.32% in 2016. Image: Fidelity Investments

Valuation Gap Between High and Low Dividend Yield Stocks

Valuation Gap Between High and Low Dividend Yield Stocks This chart shows that the valuation gap between high and low dividend yield stocks is almost the widest ever. Image: Goldman Sachs Global Investment Research

U.S. Government Bond Fund Flows

U.S. Government Bond Fund Flows Over the last six months, U.S. government bond fund flows have been the largest since 1985. Image: Goldman Sachs Global Investment Research

U.S. Effective Tariff Rate

U.S. Effective Tariff Rate The U.S. effective tariff rate is rising to the highest in 70 years. You may also like “Tariffs in United States History.” Image: Goldman Sachs Global Investment Research

Earnings Growth and the Fed Cycle

Earnings Growth and the Fed Cycle Analysts remain optimistic on 2020. This chart shows the expected earnings growth over the next 12 months. Image: Fidelity Investments