Valuation and Demographics

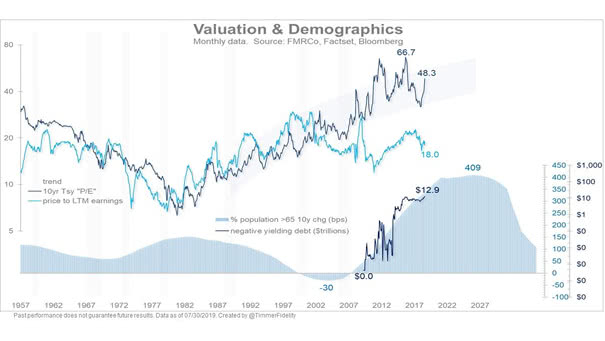
Valuation and Demographics Our world is aging with high levels of debt and low interest rates, maybe for a long time. The chart shows that an aging population affects yields. You may also like “Debt and Demographics.” Image: Fidelity Investments

U.S. Bond Market Hedged and Unhedged

U.S. Bond Market Hedged and Unhedged Investors are frantically searching for yield, knowing that 25% of all bonds in the world trade at negative interest rates. Our world is aging with high levels of debt and low interest rates (maybe for a long time). Image: Fidelity Investments

U.S. – China Competition (Focus Risk)

U.S. – China Competition (Focus Risk) The United States and China will eventually conclude a trade agreement, but tensions between the two countries are structural and won’t go away any time soon. Image: BlackRock Investment Institute

S&P 500 Index – Earnings & Valuation

S&P 500 Index – Earnings & Valuation The S&P 500 valuation is high relative to history and the earnings growth estimate has fallen to +3.7% for 2019. You may also like our “Stock Market Valuation.” Image: Fidelity Investments

S&P 500 Recovery Since The Financial Crisis

S&P 500 Recovery Since The Financial Crisis The chart shows that the S&P 500 has outperformed its historical recoveries since 2009. Image: Goldman Sachs Global Investment Research
Asset Classes Total Return since 2009

Asset Classes Total Return since the Great Recession The chart shows how asset classes and economic indicators have performed since the Great Recession. The S&P 500 is the big winner. Image: Goldman Sachs Global Investment Research
U.S. Equities and The World: Earnings Growth vs. Multiple Expansion

U.S. Equities and The World: Earnings Growth vs. Multiple Expansion Since the 2009 low, the strong performance of the U.S. markets comes from earnings growth (73%) and multiple expansion (27%). You may also like “S&P 500 Return: Earnings Growth vs. Multiple Expansion.” Image: Goldman Sachs Global Investment Research

S&P 500 – Secular Roadmaps

S&P 500 – Secular Roadmaps The chart shows the S&P 500 projection based on average secular bull and the CAPE model. Image: Fidelity Investments

Bull Markets (Total Return)

Bull Markets (Total Return) Since the March 2009 low, the S&P 500 is up 397% and remains in a long-term bull market. Image: Fidelity Investments