More than 200 Years of US Interest Rates in One Chart

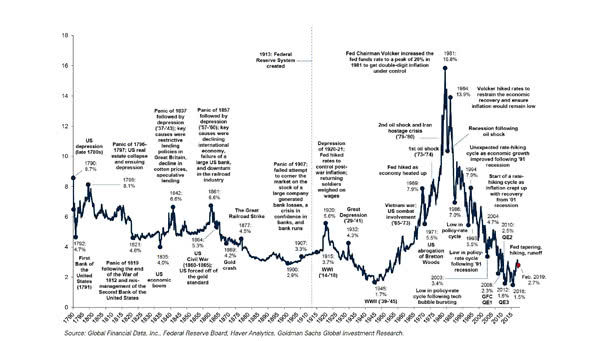
More than 200 Years of U.S. Interest Rates in One Chart This long term chart covers more than two centuries of US interest rates (yield on the U.S. 10-year Treasury). Image: Goldman Sachs Global Investment Research Click the Image to Enlarge
Investor Movement Index vs. S&P 500

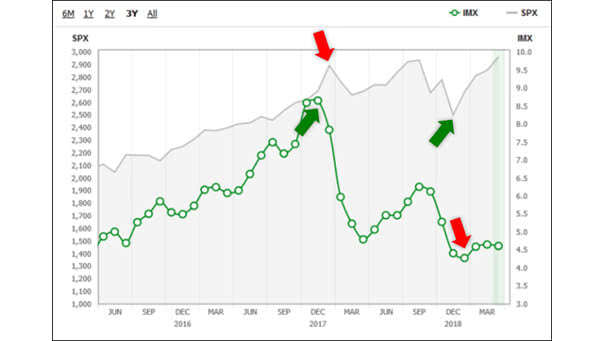
Investor Movement Index vs. S&P 500 The Investor Movement Index indicates the sentiment of TD Ameritrade retail investors. Thus, retail investors are net buyers of equities when the stock market is expensive, and they are net sellers of equities when the stock market is cheap. As usual, retail investors react to equity price movements. They buy and sell…

IPOs Tend to Underperform the Market

IPOs Tend to Underperform the Market The evidence shows that, despite their higher risk, initial public offerings make poor investments. You may also like “Unicorn IPOs, Are They Good Investments?“

Why the Fed Can’t Raise Interest Rates Above Inflation Rate, Today?

Why the Fed Can’t Raise Interest Rates Above Inflation Rate, Today? The Federal Reserve can’t raise the Fed funds rate above the inflation rate because the US productivity growth is too weak.Net Domestic Investment to GDP is in a long-term downtrend and reduces productivity.This makes it difficult to see the Fed funds rate exceed the…

Ken Fisher: ‘Third year of a president’s term is positive’

Ken Fisher: ‘Third year of a president’s term is positive’ “…because political risk aversion falls as you get to increase gridlock which happends in every midterm election.” Billionaire Ken Fisher thinks there is room to run for the stock market this year. But don’t try to time the market and keep your investment strategy simple.

The Long-Term Impact of Compounded Returns

The Long-Term Impact of Compounded Returns The amount earned from compounding grows exponentially over time. Successful investing is all about patience and discipline. So, a lack of patience and investment discipline may impact long-term returns. And keep in mind that the power compounding only works if you do not lose capital during the investment horizon. What about compound…

BlackRock Geopolitical Risk Indicator for Global Trade Tensions

BlackRock Geopolitical Risk Indicator for Global Trade Tensions The recent decline of the indicator suggests that investors may be more complacent about the risk and impact of trade conflicts. Source: BlackRock Investment Institute – Global Investment Outlook Q2 2019

The Value vs. Growth Differential Has Never Been So Extreme

The Value vs. Growth Differential Has Never Been So Extreme The Value vs. Growth differential has never been so extreme, even during the Great Depression and the Dotcom bubble. Chasing growth usually ends badly! Image: Woodford Investment Management Ltd