Growth and Inflation
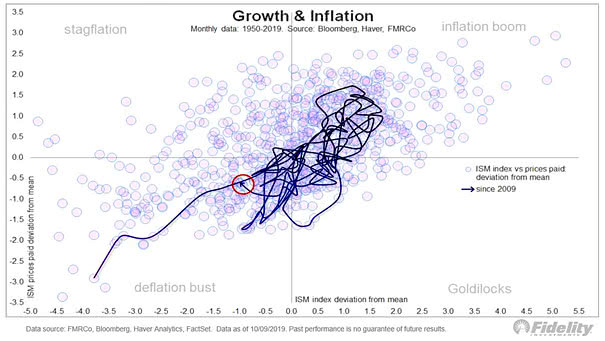
Growth and Inflation This chart shows the ISM Index vs. prices paid deviation from the mean since 2009. Currently, the U.S. manufacturing cycle has headed back into recession & deflation. Image: Fidelity Investments
Growth and Inflation This chart shows the ISM Index vs. prices paid deviation from the mean since 2009. Currently, the U.S. manufacturing cycle has headed back into recession & deflation. Image: Fidelity Investments
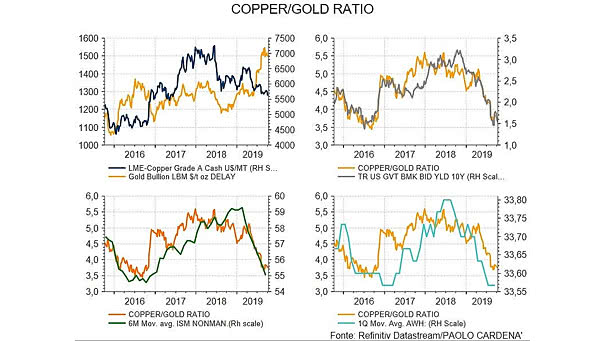
Copper to Gold Ratio The copper to gold ratio provides useful information on the evolution of the U.S. 10-year Treasury, the ISM Non-Manufacturing Index and the average weekly hours worked. Image: Paolo Cardena

Investor Sentiment – NAAIM Exposure Index and S&P 500 NAAIM Exposure Index dropped to 56.15% (median exposure at 70%). NAAIM members’ optimism was short-lived. Image: Willie Delwiche, Baird
Copper to Gold Ratio and Conference Board Leading Economic Index (LEI) When the copper-to-gold ratio decreases, it is an early warning signal for the economy, meaning that growth optimism is fading. Image: Wells Fargo Investment Institute
Fed Dovish Pivot – Stimulus Hopes Support Risk Appetite Growth sentiment appears to be stabilizing, due to optimism about fiscal policy. Image: Goldman Sachs Global Investment Research
AAII U.S. Investor Sentiment Bull vs. AAII U.S. Investor Sentiment Bear Spread The current spread suggests excessive pessimism. Image: Nautilus Research
Cass Freight Shipments Index vs. U.S. GDP The Cass Freight Shipments Index is a relative good predictive indicator of the U.S. economy. It suggests a weakness in U.S. GDP in Q2 2019. The Cass Freight Index is a measure of monthly North American freight activity. You may also like “ISM Manufacturing Index vs. Cass Freight Index.”…
Manufacturing Payrolls vs. ISM PMI Manufacturing payrolls are usually quite volatile, but this interesting chart could suggest a rebound in the ISM PMI. Let’s wait for confirmation in the second half of the year. Image: Hayek and Keynes
Americans Split on Description of U.S. Economy Today, 43% of Americans think socialism would be a good thing for the U.S.. Image: Gallup
Fear & Greed Index vs. S&P 500 Index This chart shows how optimism stays unusually low. Is this alarming for bears? Image: Cable News Network
Global Manufacturing PMIs – USA vs. Rest of the World Global ex-US manufacturing PMI is below 50 (contraction). We will see if the United States can go it alone in the coming months. You may also like “ISM Manufacturing Index vs. S&P 500 Index since 2011“ Image: Topdown Charts