Median S&P 500 EPS Growth
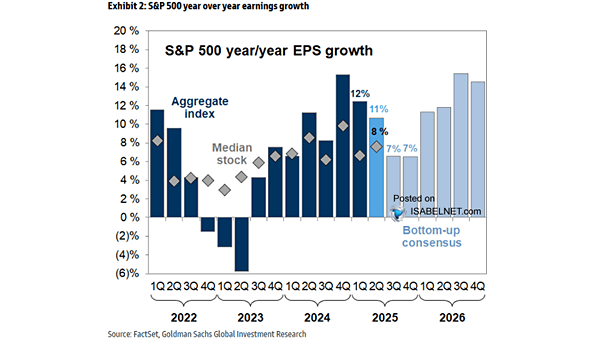
Median S&P 500 EPS Growth The median S&P 500 stock is expected to grow earnings per share by 8% this year. Image: Goldman Sachs Global Investment Research
Median S&P 500 EPS Growth The median S&P 500 stock is expected to grow earnings per share by 8% this year. Image: Goldman Sachs Global Investment Research
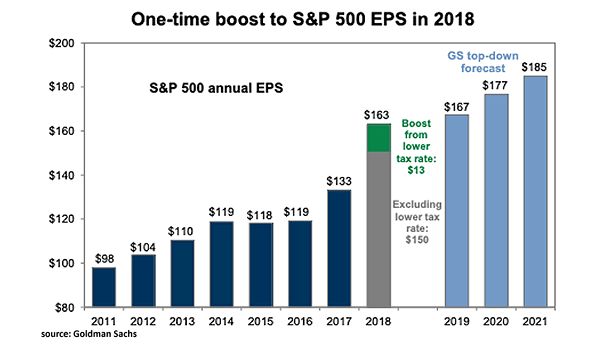
S&P 500 EPS Forecast Despite the earnings squeeze, Goldman Sachs is still positive on the S&P 500 earnings outlook. In 2020, U.S. and global growth should rebound modestly. Image: Goldman Sachs Global Investment Research

S&P 500 All-Time Highs Today, S&P 500 jumps to record high on strong earnings. This chart shows S&P 500 all-time highs since 1982. Image: Ritholtz Wealth Management LLC.
S&P 500 Tax Adjusted EPS vs. Trend Interesting chart showing that S&P 500 tax adjusted earnings are well above the trend in the United States, and have historically preceded earning plunges. Image: J.P. Morgan Asset Management
S&P 500 Valuation and Equity Risk Premium This chart shows that the equity risk premium (earnings yield less 10-year Treasury yield) has declined to 3.9%. Image: Fidelity Investments
S&P 500 EPS vs. U.S. Nonfinancial Corporate Profits Creative accounting is imaginative ways to present accounts. The divergences between earnings and U.S. nonfinancial corporate profits occur before recessions. Image: Gavekal, Macrobond
South Korean Exports vs. S&P 500 EPS Estimates The correlation between South Korean exports and S&P 500 EPS estimates suggests a weakness in S&P 500 earnings estimates. Image: Lohman Econometrics
World Semiconductor Sales and S&P 500 EPS Tight relationship between world semiconductor sales and S&P 500 earnings per share. You may also like “Semiconductor Sales vs. Global Earnings per Share.” Image: Oxford Economics