S&P 500 Buybacks vs. CEO Confidence (Leading Indicator)
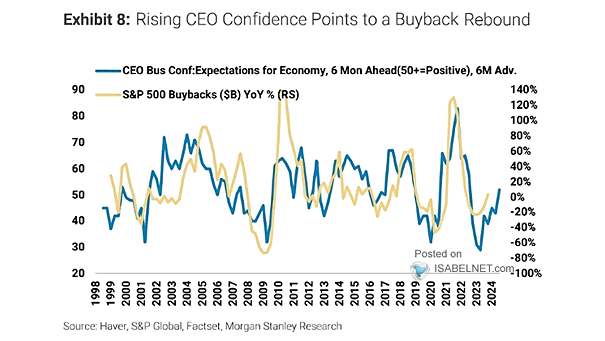
S&P 500 Buybacks vs. CEO Confidence (Leading Indicator) S&P 500 buybacks are likely to rebound, as CEO confidence typically leads buybacks by 6 months. Image: Morgan Stanley Research
S&P 500 Buybacks vs. CEO Confidence (Leading Indicator) S&P 500 buybacks are likely to rebound, as CEO confidence typically leads buybacks by 6 months. Image: Morgan Stanley Research
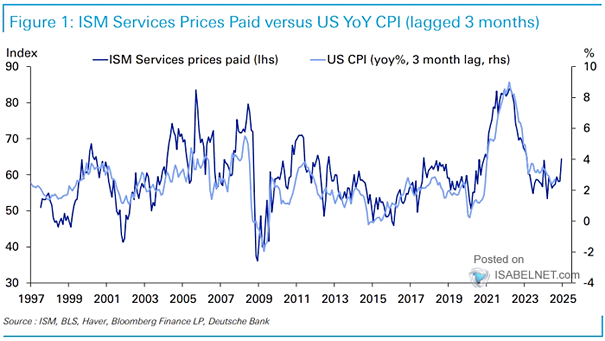
U.S. ISM Services Prices Paid Index vs. U.S. CPI Inflation (Leading Indicator) The U.S. ISM Services Prices Paid Index tends to lead U.S. CPI inflation by 2 months. Are Fed rate cuts still likely in 2024? Image: Deutsche Bank

ISM PMI and S&P 500 What does a cooling in U.S. manufacturing growth mean for the S&P 500 in the coming months? Image: BofA Global Research
Global PMI vs. Orders/Inventory Ratio (Leading Indicator) Inventory-shipment ratios suggest a surge in the global manufacturing PMI over the next 2-3 months. Image: BofA Global Investment Strategy
Are Fears About an Imminent Recession Overblown? Historically, a recession is coming when the Leading Index for the United States is below 1. Today, it stands at 1.37. “The leading index for each state predicts the six-month growth rate of the state’s coincident index. In addition to the coincident index, the models include other variables…
U.S. Freight Shipping Activity The New York Fed’s manufacturing report suggests a rebound in freight shipping activity this year. Image: Quill Intelligence, LLC
Cass Freight Shipments Index (6ma) vs. U.S. GDP The chart shows the Cass Freight Shipments Index (6-month average). It suggests a weakness in U.S. GDP in 3Q19. The Cass Freight Shipments Index is a relative good predictive indicator of the U.S. economy. You may also like “ISM Manufacturing Index vs. Cass Freight Index.” Image: Macro…
Growth and Inflation This chart shows the ISM Index vs. prices paid deviation from the mean since 2009. Currently, the U.S. manufacturing cycle has headed back into recession & deflation. Image: Fidelity Investments
Copper to Gold Ratio The copper to gold ratio provides useful information on the evolution of the U.S. 10-year Treasury, the ISM Non-Manufacturing Index and the average weekly hours worked. Image: Paolo Cardena
U.S. ISM Composite Index and U.S. Real GDP This chart shows the good correlation between the ISM Composite Index (services + manufacturing) and U.S. real GDP. What about U.S. GDP growth in 2020? Image: Deutsche Bank Global Research