Skip to the content

Advanced Stock Market Forecast for Professionals and Individuals

Connect with Us on X

isabelnet logo

ISABELNET

Advanced Stock Market Forecast for Professional and Individual

Subscribe
SEARCH  
Menu
  • Home
  • Forecasting Models
    • Stock Market Valuation
    • Stock Market Short-Term Forecast
    • Stock Market Equity Risk Premium
    • Stock Market Bull and Bear Indicator
    • Stock Market Long-Term Forecast
    • Stock Market Forecasting Models vs. US Stock Market
    • 95% Correlation, R² = 0.90 since 1970
    • Recession Indicators
    • Leading Indicators
  • Daily Blog
    • All Recent Posts
      • Daily Blog
    • A
      • AAII Sentiment Survey
      • Active
      • Active Fund
      • Active Investing
      • Activity
      • ACWI
      • Aging
      • Algorithmic Trading
      • All-Time High
      • Allocation
      • America
      • Argentina
      • Asia
      • Asset
      • Asset Class
      • Auto Loan
      • Average Claims
      • Average Return
    • B
      • BA-BL
        • Balance Sheet
        • Baltic Dry Index
        • Bank
        • Bank Reserve
        • Banking
        • Baa
        • BBB
        • Bear
        • Bear Indicator
        • Bear Market
        • Benchmark
        • Berkshire Hathaway
        • Bitcoin
        • Black Swan
      • BO-BU
        • BOE
        • BoJ
        • Bond
        • Bond Market
        • Bond Proxies
        • Bond Yield
        • Breadth
        • Brent
        • Brexit
        • Bubble
        • Budget
        • Budget Deficit
        • Bull
        • Bull and Bear Indicator
        • Bull Indicator
        • Bull Market
        • Bund
        • Business
        • Business Confidence
        • Business Cycle
        • Buyback
    • C
      • CA-CE
        • Calendar
        • Canada
        • Capex
        • Capital
        • Capital Expenditures
        • Capitalization
        • Carbon Emission
        • Cash
        • Cash Flow
        • Cass Freight Index
        • CCC
        • CEO
        • CEO Confidence
        • Central Bank
        • CFO
      • CH-CL
        • Chicago Fed National Activity Index
        • Chicago PMI Index
        • China
        • China Credit
        • China Debt
        • China GDP
        • China Manufacturing PMI
        • China Stock Market
        • Chinese
        • Citi Economic Surprise
        • Claims
        • Climate
      • CN-CON
        • CNY
        • CO2
        • CO2 Emission
        • Commercial Bank
        • Commodities
        • Commodity
        • Companies
        • Compensation
        • Compound
        • Concentration
        • Conference Board
        • Confidence
        • Conflict
        • Consensus
        • Construction
        • Consumer
        • Consumer Confidence
        • Consumer Debt
        • Consumer Expectation
        • Consumer Sentiment
        • Consumer Spending
        • Consumption
      • COP-COS
        • Copper
        • Copper to Gold Ratio
        • Core CPI
        • Core Inflation
        • Core PCE
        • Coronavirus
        • Corporate
        • Corporate Bond
        • Corporate Credit
        • Corporate Debt
        • Corporate Profits
        • Correction
        • Correlation
        • Correlation Matrix
        • Cost
        • Country
      • CP-CY
        • CPI
        • Crash
        • Credit
        • Credit Card
        • Credit Cycle
        • Credit Growth
        • Credit Impulse
        • Credit Spread
        • Crisis
        • Crypto
        • Cryptocurrency
        • Crude Oil
        • Cumulative Flow
        • Currency
        • Cycle
        • Cyclical
    • D
      • Data
      • Debt
      • Debt Ceiling
      • Debt to Equity
      • Debt to GDP
      • Debt Level
      • Defensive
      • Defensive Stock
      • Deficit
      • Deflation
      • Delinquency
      • Democrats
      • Demographics
      • Developed Market
      • Disruption
      • Divergence
      • Diversification
      • Dividend
      • DM
      • Dollar
      • Dow Jones
      • Drawdown
      • Drops
      • Durable
    • E
      • EA-EC
        • Earnings
        • Earnings Estimate
        • Earnings Growth
        • Earnings Revision
        • Earnings Yield
        • EBITDA
        • ECB
        • Economic
        • Economic Cycle
        • Economic Expansion
        • Economic Growth
        • Economic Surprise
        • Economies
        • Economy
      • EL-EQ
        • Election
        • Electric
        • Emerging
        • Emerging Market
        • Empire State Manufacturing Survey
        • Employment
        • Energy
        • EPS
        • EPS Growth
        • EPS Revision
        • Equities
        • Equity
        • Equity Exposure
        • Equity Market
        • Equity Risk Premium
      • ET-EX
        • ETF
        • EUR/USD
        • Euro / US Dollar
        • Euro Area
        • Europe
        • European Equity
        • European Union
        • Eurozone
        • Export
        • Exposure
    • F
      • FA-FE
        • FAANG
        • Fair Valuation
        • Fair Value
        • Fear
        • Fear & Greed Index
        • Fed
        • Fed Funds
        • Fed Insurance Cut
        • Fed Rate
        • Fed Rate Cut
        • Fed Rate Hike
        • Fed Tightening
        • Federal Debt
        • Federal Reserve
        • FedEx
      • FI-FU
        • Financial
        • Financial Conditions
        • Fiscal Policy
        • Fixed Income
        • Flow
        • FOMC
        • Forecast
        • Foreign
        • Foreign Exchange Rate
        • Forex
        • Forward EPS
        • Forward P/E Ratio
        • Free Cash Flow
        • Freight
        • Fund Flow
        • Funds
        • Futures
        • FX
    • G
      • GA-GI
        • G3
        • G7
        • G10
        • Gap
        • GBP
        • GDP
        • GDPNow
        • Generation
        • Geopolitic
        • German
        • Germany
        • Gini Coefficient
      • GLOBAL
        • Global Debt
        • Global Earnings
        • Global Economy
        • Global Employment
        • Global Equity
        • Global Equities
        • Global EPS
        • Global Flow
        • Global GDP
        • Global Growth
        • Global Inflation
        • Global M1
        • Global Manufacturing
        • Global Manufacturing PMI
        • Global Market
        • Global Monetary Policy
        • Global Money Supply
        • Global PMI
        • Global Recession
        • Global Sales
        • Global Stock Market
        • Global Trade
        • Globalization
      • GO-GR
        • Gold
        • Gold Ratio
        • Gold Reserve
        • Goods
        • Government
        • Government Bond
        • Government Debt
        • Greece
        • Gross Margin
        • Growth
        • Growth Stock
    • H
      • Hard Data
      • Health
      • Health Care
      • Heavy Truck Sales
      • Hedge
      • Hedge Fund
      • Hedge Fund Exposure
      • High Yield
      • Historical
      • Home
      • Home Price
      • Home Sales
      • House
      • Household
      • Household Debt
      • Housing
      • Housing Bubble
    • I
      • IF-INS
        • IFO
        • IG Bond
        • Immigrant
        • Import
        • Income
        • India
        • Indicator
        • Industrial
        • Industrial Production
        • Industry
        • Inequality
        • Inflation
        • Inflow
        • Insider
        • Insurance Cut
      • INT-ISM
        • Interest Rate
        • Intrinsic Value
        • Investment
        • Investment Grade
        • Investor
        • Investor Sentiment
        • IPO
        • ISABELNET Cartoon of the Day
        • ISM
        • ISM Composite Index
        • ISM Composite PMI
        • ISM Manufacturing Index
        • ISM Non-Manufacturing Index
    • J
      • Japan
      • Japan Corporate Profits
      • Job
      • Job Growth
      • Job Openings
      • Jobless Claims
      • Junk Bonds
    • K
      • KC Fed Labor Market Conditions Index
      • Korea
    • L
      • Labor
      • Labor Force
      • Labor Market
      • Large Cap
      • Leading Economic Index
      • Leading Indicators
      • LEI
      • Leverage
      • Leveraged Loan
      • Liquidity
      • Listed Companies
      • Loan
      • Long-Term Trend
      • Low Volatility
      • Lumber
    • M
      • M1-MA
        • M1
        • M2
        • M2 Velocity
        • M&A
        • Madness
        • Manufacturing
        • Manufacturing PMI
        • Map
        • Margin
        • Margin Debt
        • Market
        • Market Capitalization
        • Market Cycle
        • Market Performance
        • Market Return
        • Market Sentiment
        • Market Share
        • Market Valuation
        • Maturity
      • MI-MOR
        • Millionaire
        • Misery Index
        • Momentum
        • Monetary Policy
        • Money Supply
        • Money
        • Money Market
        • Monthly Return
        • Mortgage
        • Mortgage Rate
      • MOV-MU
        • MOVE
        • Moving Average
        • MSCI
        • MSCI ACWI
        • MSCI All Country World Index
        • MSCI Europe
        • MSCI World
        • MSCI World Growth
        • MSCI World Value
        • Multiple
        • Multiple Expansion
        • Mutual Fund
    • N
      • NAAIM
      • NAHB
      • Nasdaq
      • National Debt
      • NBER
      • Negative Rate
      • Negative Yield
      • New High
      • New Home Sales
      • NFIB
      • Nikkei
      • NIPA Profits
      • Non-Manufacturing
      • Nonfarm Payroll
    • O
      • OECD
      • OECD Composite Leading Indicator
      • Oil
      • Oil Market
      • Oil Price
      • Oil Share
      • OPEC
      • Operating Earnings
      • Outbreak
      • Outflow
      • Outlook
      • Outperformance
      • Output Gap
      • Overvaluation
      • Overvalue
    • P
      • PA-PH
        • Passive
        • Passive Fund
        • Passive Investing
        • Payout Ratio
        • Payroll
        • PCE
        • P/E Ratio
        • Performance
        • Personal Consumption Expenditure
        • Philadelphia Semiconductor Index
        • Philly Fed
      • PM-PREM
        • PMI
        • Policy
        • Policy Easing
        • Policy Rate
        • Policy Uncertainty
        • Population
        • Portfolio
        • Prediction
        • Premium
      • PRES-PU
        • President
        • Presidential
        • Presidential Election
        • Price
        • Price Target
        • Private Debt
        • Private Equity
        • Probability
        • Productivity
        • Projection
        • Profit
        • Profit Margin
        • Potential GDP
        • Pullback
    • Q
      • Quant
      • Quantitative Easing
      • Quantitative Tightening
      • Quote
    • R
      • RA-REA
        • R-squared
        • R-Star
        • R&D
        • Rallies
        • Rally
        • Ranking
        • Rate Cut
        • Rate Hike
        • Rates
        • Rating
        • Ratio
        • Real Estate
        • Real GDP
        • Real Yield
      • REA-RET
        • Recession
        • Record High
        • Recovery
        • Reflation
        • Region
        • Repo Market
        • Republicans
        • Repurchase
        • Reserve
        • Retail
        • Retail Sales
        • Return
      • REV-RU
        • Revenue
        • Revision
        • Richmond Fed Survey
        • Risk
        • Risk Appetite
        • Risk Parity
        • Risk Premium
        • Rotation
        • Russell
        • Russia
    • S
      • S&P 500 AL-GA
        • S&P 500
        • S&P 500 All-Time High
        • S&P 500 Bear Market
        • S&P 500 Bull Market
        • S&P 500 Buyback
        • S&P 500 Cycle
        • S&P 500 Dividend
        • S&P 500 Drawdown
        • S&P 500 Earnings
        • S&P 500 Election
        • S&P 500 EPS
        • S&P 500 ETF
        • S&P 500 Gain
      • S&P 500 FO-VO
        • S&P 500 Forecast
        • S&P 500 Future
        • S&P 500 Performance
        • S&P 500 Price
        • S&P 500 Projection
        • S&P 500 Pullback
        • S&P 500 Return
        • S&P 500 Seasonal
        • S&P 500 Short Interest
        • S&P 500 Stock
        • S&P 500 Valuation
        • S&P 500 Volatility
      • SA-SE
        • Sales
        • Saudi Arabia
        • Saving
        • Seasonal
        • Secular
        • Secular Bull Market
        • Securities
        • Sell in May
        • Semiconductor
        • Sentiment
        • Service
      • SH-SM
        • Shale
        • Share Buybacks
        • Shareholder
        • Sharpe Ratio
        • Short Interest
        • Silver
        • Singapore
        • Slope
        • Small Business
        • Small Cap
      • SO-STOC
        • Soft Data
        • South Korea
        • South Korea Export
        • Sovereign
        • Spending
        • Spread
        • Stock Buybacks
        • Stock Market
        • Stocks
      • STOO-SW
        • Stoxx 600
        • Strategy
        • Student Loan
        • Surprise
        • Survey
        • Swan
    • T
      • TA-TI
        • T-Bill
        • Taiwan
        • Target
        • Tariff
        • Tax
        • Tech
        • Term Premium
        • Term Structure
        • Tightening
        • TIPS
      • TRA
        • Trade
        • Trade Balance
        • Trade Conflict
        • Trade Deal
        • Trade Tension
        • Trade War
        • Trading
      • TRE-TW
        • Treasuries
        • Treasury
        • Treasury Holdings
        • Trend
        • Truck
        • Truck Tonnage
        • Trump
        • Twin Deficits
    • U
      • UN
        • Unemployment
        • Unemployment Rate
        • Uncertainty
        • Unicorn
        • United States
        • University of Michigan Consumer Sentiment Index
      • US-UT
        • U.S.
        • U.S. Debt
        • U.S. Dollar
        • U.S. Economy
        • U.S. GDP
        • U.S. PMI
        • USA
        • USD
        • USD/CNY
        • Utilities
        • Utility
    • V
      • Valuation
      • Value
      • Value Stock
      • Velocity
      • Venezuela
      • Virus
      • VIX
      • VIX Term Structure
      • Volatility
      • Volume
    • W
      • WA-WE
        • Wage
        • Wage Growth
        • Wall of Worry
        • Wealth
        • Wealth Inequality
      • WORLD
        • World
        • World Debt
        • World Economy
        • World Equities
        • World EPS
        • World GDP
        • World Growth
        • World Trade
      • WT
        • WTI
    • Y
      • YouTube
        • > All Interviews
        • Charlie Munger
        • Howard Marks
        • Jeffrey Gundlach
        • Ken Fisher
        • Ray Dalio
        • Thomas Russo
        • Warren Buffett
      • Yen
      • Yield
      • Yield Curve
      • Yield Curve Inversion
      • Yield Spread
      • Yuan
    • Z
      • Zombie Companies
    • 2-30
      • 2
        • 2-Year
        • 2-Year Yield
        • 200D
        • 200MA
        • 2s-10s
      • 5
        • 5-Year
        • 5-Year Yield
      • 10
        • 10-Year
        • 10-Year Yield
        • 10Y-2Y
        • 10Y-3M
      • 30
        • 30-Year
        • 30-Year Yield
        • 30Y-10Y
  • Log In
    • Basic Membership
    • Premium Membership
    • Pro Membership
    • Retrieve Your Password
    • Renew Your Visa/MasterCard
    • Log Out
  • Contact
  • FAQ
  • About

Search Results for: ISM


Net % OW Equities vs. Net % Expecting Stronger Economy
Aug 17 2022

Net % OW Equities vs. Net % Expecting Stronger Economy

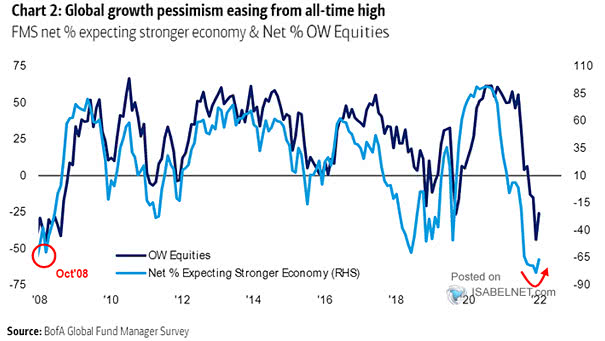
Net % OW Equities vs. Net % Expecting Stronger Economy Pessimism about global growth is easing, suggesting a higher net equity allocation. Image: BofA Global Fund Manager Survey

S&P 500 Earnings Per Share and Recessions
Aug 13 2022

S&P 500 Earnings Per Share and Recessions

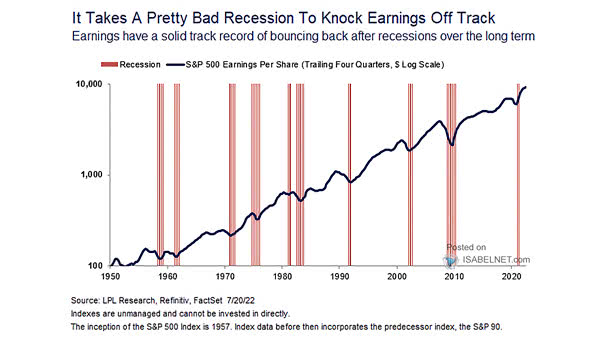
S&P 500 Earnings Per Share and Recessions Is pessimism justified when it comes to S&P 500 earnings? Image: LPL Research

U.S. 10Y-2Y Treasury Yield Spread and U.S. 2-Year Treasury Yield
Nov 03 2021

Yield Curve – U.S. 10Y-2Y Treasury Yield Spread and U.S. 2-Year Treasury Yield

Yield Curve – U.S. 10Y-2Y Treasury Yield Spread and U.S. 2-Year Treasury Yield Does the flattening of the yield curve signal skepticism about the prospects for economic growth? Image: Morgan Stanley Research

AAII Survey - Investor Asset Allocations - Equities
Jul 08 2021

AAII Survey: Investor Asset Allocations – Equities

AAII Survey: Investor Asset Allocations – Equities The AAII allocation to equities is reaching extreme optimism. Image: Topdown Charts

FMS Global Equities Allocation
Jun 18 2021

Equity – FMS Global Equities Allocation

Equity – FMS Global Equities Allocation Peak optimism? FMS global equities allocation remains at a high level. Image: BofA Global Fund Manager Survey

Average Short Interest on Companies in the S&P 500
Jun 14 2021

Average Short Interest on Companies in the S&P 500

Average Short Interest on Companies in the S&P 500 Sign of optimism or complacency?  Short interest on companies in the S&P 500 continues to decline. Image: Financial Times

Russell 2000 Distance from 200-Day Moving Average
Feb 09 2021

Small Caps – Russell 2000 Distance from 200-Day Moving Average

Small Caps – Russell 2000 Distance from 200-Day Moving Average Is there is too much optimism built into small-caps? Image: Bespoke Investment Group

S&P 500 Growth Index and Percent of IPOs with Negative EPS
Feb 03 2021

S&P 500 Growth Index and Percent of IPOs with Negative EPS

S&P 500 Growth Index and Percent of IPOs with Negative EPS Growing signs of speculation and optimism, as more unprofitable companies are going public. Image: Alpine Macro

Small-Cap Stocks - Russell 2000 and 200-Day Moving Average
Dec 24 2020

Small-Cap Stocks – Russell 2000 and 200-Day Moving Average

Small-Cap Stocks – Russell 2000 and 200-Day Moving Average There is a lot of optimism built into small-caps. Image: Strategas Research Partners

Weekly Flows into U.S. Funds Buying Inflation-Protected Securities
Dec 04 2020

Weekly Flows into U.S. Funds Buying Inflation-Protected Securities

Weekly Flows into U.S. Funds Buying Inflation-Protected Securities Investors demand for inflation-protected securities is on the rise as economic optimism surges. Image: Financial Times

Gold Price - Worst Month in Four Years
Nov 30 2020

Gold Price – Worst Month in Four Years

Gold Price – Worst Month in Four Years Gold continues to fall out of favour on vaccine optimism. Image: Financial Times

Posts navigation

Previous 1 … 25 26 27 … 29 Next

RECENT POSTS

U.S. Market Greed/Fear Index

Investor Sentiment – U.S. Market Greed/Fear Index

06/30/2025 Off
S&P 500 Index Quarterly Returns Based on the Four-Year Presidential Cycle

S&P 500 Index Quarterly Returns Based on the Four-Year Presidential Cycle

06/30/2025 Off
Insider Transactions Ratio

Insider Transactions Ratio

06/30/2025 Off
Consolidated Equity Positioning

Consolidated Equity Positioning

06/30/2025 Off
Bottom-Up Consensus S&P 500 EPS Estimates

Bottom-Up Consensus S&P 500 EPS Estimates

06/30/2025 Off

Forecasting Models

  • Stock Market Valuation
  • Stock Market Short-Term Forecast
  • Stock Market Equity Risk Premium
  • Stock Market Bull and Bear Indicator
  • Stock Market Long-Term Forecast
  • Forecasting Models vs. Stock Market
  • 95% Correlation, R² = 0.90 since 1970
  • Recession Indicators
  • Leading Indicators

Daily Blog

  • Daily Blog Posts

About

  • About Isabelnet
  • FAQ
  • Contact
  • Home

Membership

  • Subscribe
  • Basic Membership
  • Premium Membership
  • Pro Membership
  • Retrieve your Password
  • Renew your Visa/MasterCard
  • Log Out

Legal

  • Terms of Use
  • Privacy Policy
  • Legal Notice

Follow Us

Icon Small

© 1998-2025 ISABELNET S.A.

The opinion expressed on this website is for informational & educational purposes only and is not intended as advice to buy or sell securities

The forecasts set forth may not develop as predicted. Past performance is no guarantee, nor is it indicative of future results

Custom Search