S&P 500 2020 Target Models
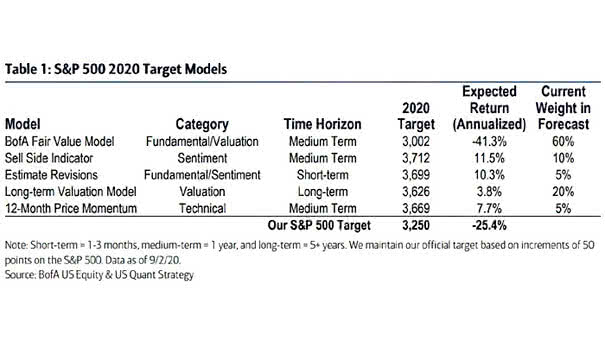
S&P 500 2020 Target Models BofA has raised its S&P 500 price target for 2020 from 2,900 to 3,250, but still below current market levels. Image: BofA US Equity & US Quant Strategy
S&P 500 2020 Target Models BofA has raised its S&P 500 price target for 2020 from 2,900 to 3,250, but still below current market levels. Image: BofA US Equity & US Quant Strategy
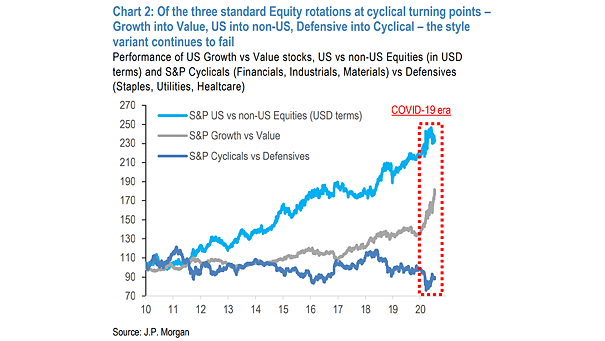
Performance of U.S. Growth vs. Value Stocks, U.S. vs. non-U.S. Equities and S&P Cyclicals vs. Defensives Equity rotation are delivering for non-U.S. vs. U.S. markets and Cyclicals vs. Defensives, but not for Value vs. Growth. Image: J.P. Morgan

S&P 500 Dividend Futures Curve vs. 2019 Dividends The dividend futures market may be too negative, as it was the case in 2008. Image: BofA US Equity & Quant Strategy
Liquidity and S&P 500 Liquidity in U.S. equity collapsed in early 2018 and remained at an extreme low. Lack of liquidity tends to lead to violent market moves. Image: Deutsche Bank Asset Allocation
S&P 500 Operating EPS vs. Normalized EPS The gap between operating and normalized EPS is the widest since Q3 2007 (the prior market peak). Image: BofA US Equity & Quant Strategy
Returns Driven by Central Banks? This chart suggests that equity and credit markets are no longer driven by fundamentals, at the moment. Image: Deutsche Bank Global Research
S&P 500 PE Level vs. Average 12-month Return The chart shows how market valuation affects future equity returns since 1930. You may also like “Why the Stock Market Valuation Matters Before a Recession?“ Image: Richardson Wealth
50 Percent of US Stock Fund Assets Are Invested in Index Funds Until active equity funds drop fees, the flow into passive equity funds will certainly continue. But could markets become inefficient if everyone buys index funds? Image: Morningstar
Investor Movement Index vs. S&P 500 The Investor Movement Index indicates the sentiment of TD Ameritrade retail investors. Thus, retail investors are net buyers of equities when the stock market is expensive, and they are net sellers of equities when the stock market is cheap. As usual, retail investors react to equity price movements. They buy and sell…
Why Lower Bond Yields Influence the S&P 500? Because lower interest rates push stock market multiples higher. If interest rates are lower, then the value of future cash flows increases, because future cash flows are discounted back at a lower interest rate. So, lower U.S. 10-year yields influence the stock market equity risk premium. On the other…
Over The Last 6 Months, The S&P 500 Lags Bonds, Gold And Global Stocks Last year, the sell-off of stocks was a correction from a bad equity risk premium and an overvalued stock market, as suggested by our forecasting models. Image: Bloomberg