Citi Economic Surprise Index vs. EUR/USD
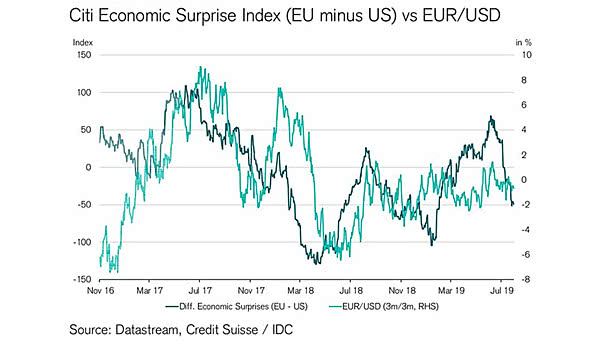
Citi Economic Surprise Index vs. EUR/USD Weaker European growth relative to the U.S. could weaken Euro/U.S. Dollar. Image: Credit Suisse
Citi Economic Surprise Index vs. EUR/USD Weaker European growth relative to the U.S. could weaken Euro/U.S. Dollar. Image: Credit Suisse
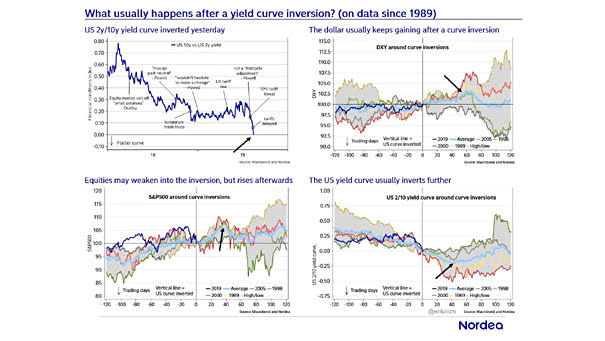
What Usually Happens After A Yield Curve Inversion? Usually, the dollar keeps gaining, equities rises afterwards and the yield curve inverts further. Image: Nordea and Macrobond

EUR/USD and 10-Year Rates Differential The chart shows the Euro vs. US Dollar (EUR/USD) and how a 10-year rates differential corresponds to a stronger or weaker US dollar. Image: Oxford Economics, Macrobond
Maximum Intra-Year Drawdown for the S&P 500 Since 1950, the median maximum drawdown for the S&P 500 is -10.6% and the average is -13.5%. You may also like “S&P 500 Index Drawdowns From 2 Year Highs.” Image: Of Dollars And Data
Maximum Drawdown vs. Annual S&P 500 Returns The annual return of the S&P 500 can be positive, even after a large drawdown. Image: Of Dollars And Data
GDP Growth Differential: U.S. vs. European Union U.S. GDP growth has been stronger than in the European Union in 28 of the last 40 quarters. It can explain why the U.S. dollar has been so strong relative to the euro. Image: Brandywine Global
Are US-China Trade Talks “Going Very Well” As Donald Trump Says? Well, in 2018, China was selling its US Treasury securities. In 2019, it’s just the opposite. Not bad! Why? It is not obvious, but China could use the dollars elsewhere, in Middle East countries for oil supplies, instead of buying US Treasury securities. Image: Ryan Detrick,…
China trade deal could spark a big rally, says Jeremy Siegel Jeremy Siegel is the Russell E. Palmer Professor of Finance at the Wharton School of the University of Pennsylvania in Philadelphia. He comments on China trade talks and the effects on the stock market. He’s worry that the dollar has been very strong. https://www.youtube.com/watch?v=_7Y1id-I88I