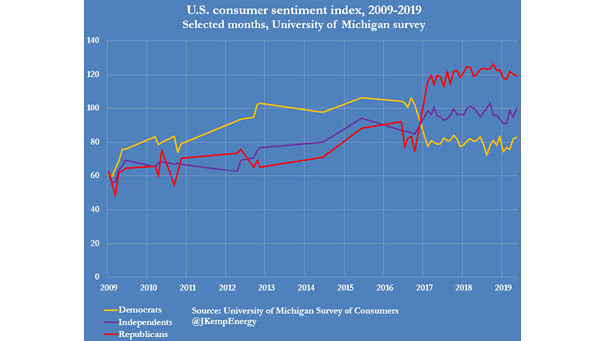
GDP-Based Recession Indicator Index

GDP-Based Recession Indicator Index This index measures the probability that the U.S. economy was in a recession during the indicated quarter. In Q1 2019, the probability of recession was 2.90%. When this recession indicator exceeds 35% (red line), history tells us that the probability of recession is increasing.

U.S. Unemployment Rate and Wage Growth

U.S. Unemployment Rate and Wage Growth U.S. unemployment rate at 3.7% and U.S. wage growth at 3.2% in July. U.S. employment growth slows, suggesting the U.S. economy is cooling. Image: Jeroen Blokland

FedEx Stock Price Leads World Trade Volume by Three Months

FedEx Stock Price Leads World Trade Volume by Three Months This chart suggests that FedEx is usually a good leading indicator of the world economy. You may also like “FedEx vs. World Trade.” Image: Deutsche Bank Global Research

Global Nominal GDP

Global Nominal GDP After the U.S., China is the world’s second largest economy. Its nominal GDP represents 16% of world GDP, compared to 24% for the United States. Image: Scotiabank

Home Builder Sentiment Leads Consumer Spending

Home Builder Sentiment Leads Consumer Spending Interesting chart suggesting that the NAHB housing market index leads the change in consumer spending. The latest reading for July suggests that the outlook for the U.S. economy is expected to slow. Image: Dr Thomas Kevin Swift

Cass Freight Shipments Index vs. U.S. GDP

Cass Freight Shipments Index vs. U.S. GDP The Cass Freight Shipments Index is a relative good predictive indicator of the U.S. economy. It suggests a weakness in U.S. GDP in Q2 2019. The Cass Freight Index is a measure of monthly North American freight activity. You may also like “ISM Manufacturing Index vs. Cass Freight Index.”…

Citi Global Economic Surprise Index and Baltic Dry Index

Citi Global Economic Surprise Index and Baltic Dry Index The divergence between the Baltic Dry Index and the Citi Global Economic Surprise Index could suggest that “global economy is likely to bottom soon.” Image: Nomura

S&P 500 Index vs. Global M1 Liquidity

S&P 500 Index vs. Global M1 Liquidity Another good correlation between the S&P 500 Index and global M1 liquidity, while the Fed plans to stop quantitative tightening. The money supply M1 is the amount of effective money in the economy. Image: Nordea and Macrobond

Longest Economic Expansion in U.S. History

Longest Economic Expansion in U.S. History Since the Great Recession, the U.S. economy has grown for 121 consecutive months. This is the longest economic expansion in American history. You may also like “Strength of Economic Expansions.” Image: Ryan Detrick, LPL Financial LLC

U.S. Yield Curve and Growth/Value P/E Ratio

U.S. Yield Curve and Growth/Value P/E Ratio The chart below shows that the shape of yield curve explains nearly 50% of the variation in value vs. growth multiples. Actually, when the U.S. economy is sluggish, investors prefer growth stocks. Image: BlackRock, Inc.