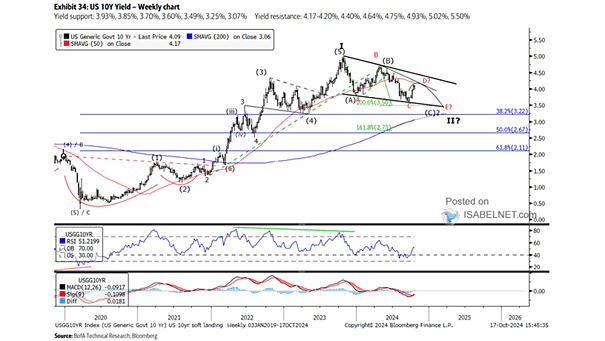
U.S. 10-Year Treasury Yield – Weekly Chart

U.S. 10-Year Treasury Yield – Weekly Chart The outlook for the U.S. 10-year Treasury yield suggests a declining trend in the fourth quarter of 2024 and into the first quarter of 2025. Image: BofA Technical Research

U.S. 10-Year Treasury Yield

U.S. 10-Year Treasury Yield The 10-year U.S. Treasury yield has been in a secular bear market since February 2022, and it could potentially approach 6% in the coming years. Image: BofA Global Research

Forecast – U.S. 10-Year Treasury Yield

Forecast – U.S. 10-Year Treasury Yield According to consensus, the 10-year U.S. Treasury yield is expected to reach 4.20% by the end of 2024. Image: The Daily Shot

U.S. 10-Year Treasury Yield Since 1790

U.S. 10-Year Treasury Yield Since 1790 The trajectory and duration of the U.S. bond bear market can be influenced by factors such as inflation, economic growth, and the Federal Reserve’s monetary policy. Image: BofA Global Investment Strategy

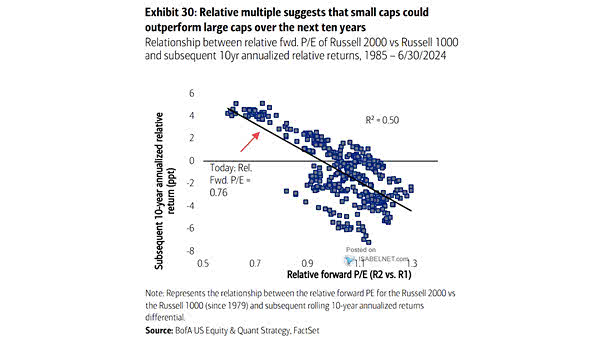
Russell 2000 Forward P/E vs. Subsequent 10-Year Annualized Returns

Russell 2000 Forward P/E vs. Subsequent 10-Year Annualized Returns Should long-term investors increase their allocation to U.S. small-cap stocks, given the potential for 9% annualized ten-year returns suggested by the absolute forward P/E for the Russell 2000? Image: BofA US Equity & Quant Strategy
U.S. 10-Year Real Rate

U.S. 10-Year Real Rate A potential rise in U.S. real rates could cause the collapse of the AI bubble, leading to turbulence in the stock market. Overvalued AI companies facing declines could trigger widespread market instability, eroding investor confidence. Image: BofA Global Investment Strategy

Real Market Cap to GDP Ratio vs. Expected 10-Year Forward Returns

Real Market Cap to GDP Ratio vs. Expected 10-Year Forward Returns The current elevated inflation-adjusted market capitalization to GDP ratio suggests the likelihood of anemic returns for the U.S. stock market over the next 10 years. Image: Real Investment Advice

10-Year U.S. Treasury Yield

10-Year U.S. Treasury Yield Since the Global Financial Crisis, there have been only two other occasions where the 10-year U.S. Treasury yield has experienced such a rapid decline, underscoring the exceptional nature of the current situation. Image: Deutsche Bank

S&P 500 vs. U.S. 10-Year Treasury Yield

S&P 500 vs. 10-Year U.S. Treasury Yield Since August 2023, there has been a strong correlation between the S&P 500 index and the 10-year U.S. Treasury yield, which has been a significant factor in shaping market dynamics and investment strategies in recent months. Image: Deutsche Bank