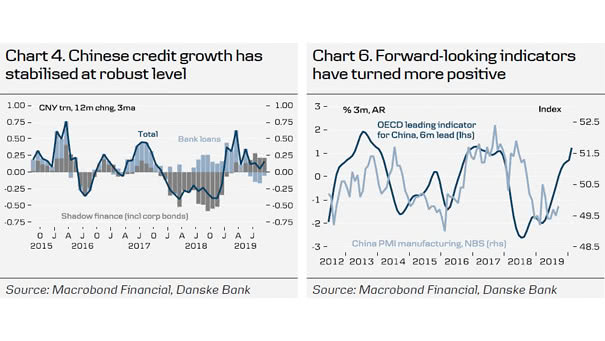
Chinese Credit Growth and OECD Leading Indicator for China

Chinese Credit Growth and OECD Leading Indicator for China Chinese Credit growth rebounded in September and suggests stronger activity on the horizon. The OECD leading indicator for China picked up further at the highest level since 2017. Image: Danske Bank Research

OECD Composite Leading Indicators

OECD Composite Leading Indicators Interesting chart showing the percentage of countries with OECD composite leading indices below the Unites States. Image: Bianco Research

OECD Composite Leading Indicator

OECD Composite Leading Indicator Leading economic indicators suggest that the global economy may have bottomed. Image: Gavekal, Macrobond

Cumulative Number of Global Rate Cuts since the Global Financial Crisis

Cumulative Number of Global Rate Cuts since the Global Financial Crisis This chart puts into perspective the cumulative number of global rate cuts since the Global Financial Crisis. In 2019, central banks in OECD countries haven’t cut this much since the Great Financial Crisis. Image: BofA Merrill Lynch Global Research

Number of Countries in Each Cycle Stage

Number of Countries in Each Cycle Stage Chart suggesting that the global synchronised slowdown is over. According to the OECD leading indicators, the number of countries in recovery is rising. Image: TS Lombard