WTI Spot Oil Price and Cash Floor
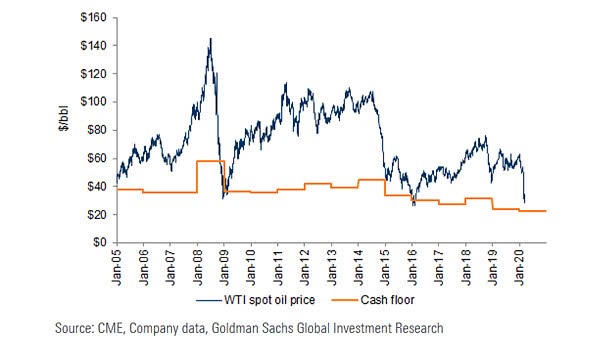
WTI Spot Oil Price and Cash Floor The chart suggests that there is a risk that oil prices move to cash costs. Image: Goldman Sachs Global Investment Research
WTI Spot Oil Price and Cash Floor The chart suggests that there is a risk that oil prices move to cash costs. Image: Goldman Sachs Global Investment Research
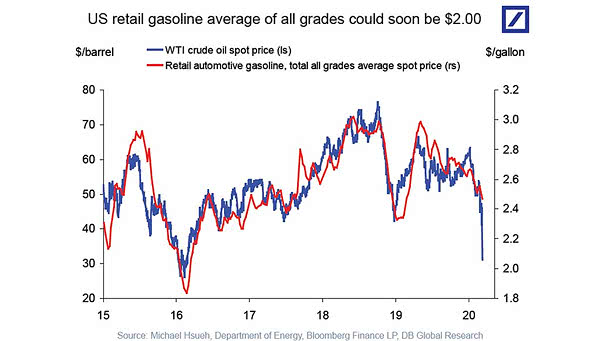
WTI Crude Oil Spot Price and Retail Automotive Gasoline U.S. retail gasoline prices are expected to fall, as OPEC+ failed to agree production cuts. Image: Deutsche Bank Global Research

DM Real GDP and WTI Crude Oil (Leading Indicator) Chart suggesting that the 18-month rate of change of WTI crude oil (inverted) tends to lead DM real GDP by 18 months. Image: Topdown Charts
S&P 500 / WTI Spot Price, Detrended The roughly 30-year cycle in the relationship between U.S. stock market returns and oil prices highlights periods when stocks are either expensive or cheap relative to oil. Image: Gavekal, Macrobond
WTI Price and Brent Price vs. Oil Inventory Oil inventories suggest that the price of oil is currently fairly priced. Image: Pictet Wealth Management
Brent Crude Oil vs. S&P 500 Index A short-term spike in oil prices may cause market jitters, but only a sustained, significant increase would meaningfully affect U.S. stocks and the broader economy; currently, economic and equity impacts remain limited. Image: Bloomberg
Breakeven Prices for Existing U.S. Oil Wells Breakeven prices for existing U.S. oil wells highlights that the current WTI oil price is too low for oil companies to make a decent return. Image: Federal Reserve Bank of Dallas Energy Survey
Does Surging Oil Prices Cause Recession? Historically, a rise oil prices can cause recession because high inflation tends to lead to higher interest rates. But nowadays, oil shale production in the US limits the rise in oil prices and makes it possible to avoid a future crisis like the one in 2008.