Buybacks – S&P 500 Cash as % of Total Asset
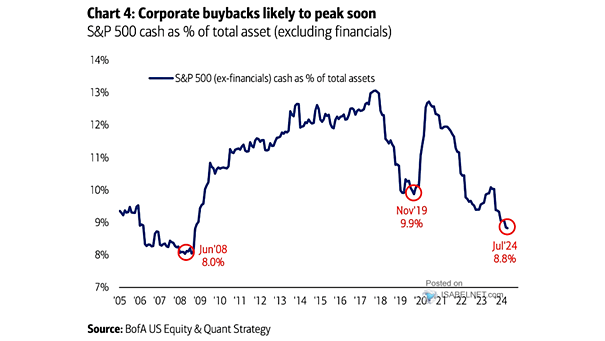
Buybacks – S&P 500 Cash as % of Total Asset As S&P 500 companies’ cash reserves decline, Bank of America expects buybacks to peak soon. Image: BofA US Equity & Quant Strategy
Buybacks – S&P 500 Cash as % of Total Asset As S&P 500 companies’ cash reserves decline, Bank of America expects buybacks to peak soon. Image: BofA US Equity & Quant Strategy
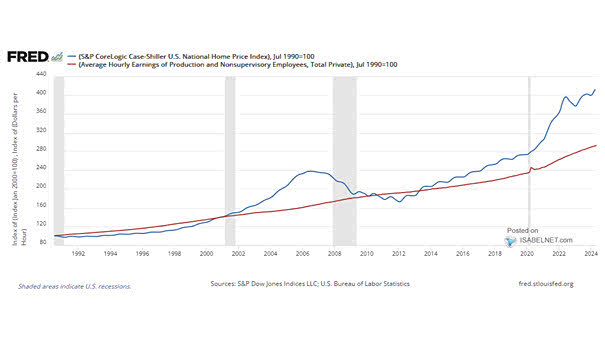
Wage Growth vs. U.S. Home Price Growth The widening gap between U.S. home prices and wage growth has significant implications for housing affordability and economic inequality, making it harder for lower-income individuals and families to afford homes. Image: Federal Reserve Bank of St. Louis

Fed – Number of Policy Rate Adjustments Throughout history, the Federal Reserve has made decisions that are not influenced by the election cycle, as the central bank’s actions are predominantly guided by economic indicators and its dual mandate. Image: BofA Global Research
U.S. Unemployment Rate Forecast According to Deutsche Bank, a mild recession in the United States may result in a modestly higher unemployment rate than what is anticipated by both consensus and the Federal Reserve. Image: Deutsche Bank
U.S. M2 to Nominal GDP Ratio The return of the U.S. M2 to nominal GDP ratio to its long-term trend is a positive indicator. It reflects a healthier balance between money supply and economic output, fostering stability and sustainable growth in the economy. Image: Federal Reserve Bank of St. Louis
Flexible and Sticky Inflation Flexible inflation (core goods) has fallen significantly and sticky inflation (core services) is still declining, which is good news as it suggests a moderation in the inflation rate. Image: Federal Reserve Bank of St. Louis
U.S. Recession – Philadelphia Fed’s State Coincident Indexes – Number of States with Negative Growth Recession risks are still increasing in the United States. Image: Federal Reserve Bank of St. Louis
New York Fed GDP Nowcast The New York Fed’s GDP Nowcast stands at 3.79% for 2021:Q3. Image: Federal Reserve Bank of New York Click the Image to Enlarge
Inflation – TIPS and Equity Sector Fund Flows Strong fund inflows into TIPS, materials, energy and financials. Will the Federal Reserve let the U.S. economy run hot? Image: Deutsche Bank Asset Allocation
U.S. Labor Market Distributions Spider Chart The U.S. labor market distributions spider chart shows broad labor market developments. Image: Federal Reserve Bank of Atlanta