U.S. Deficit Projection

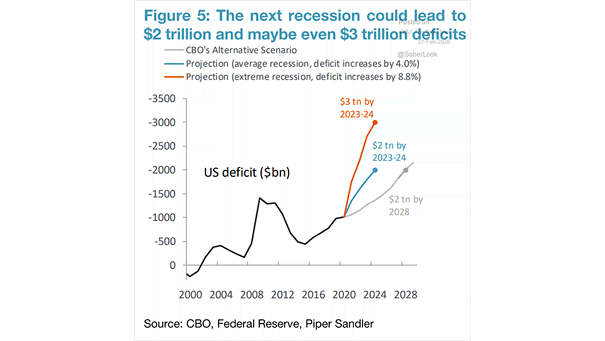
U.S. Deficit Projection Chart suggesting that the next recession could boost the U.S. deficit to unprecedented levels. Image: Piper Sandler

U.S. Trade Deficit to GDP

U.S. Trade Deficit to GDP The chart shows that the U.S. trade deficit as percentage of gross domestic product is still huge, despite the US-China trade war. Image: BofA Merrill Lynch Global Research

U.S. Surplus/Deficit As A Percentage of GDP

U.S. Surplus/Deficit As A Percentage of GDP The US federal government’s budget deficit jumps above $1 trillion for the first time over the past 12 months. Image: Bianco Research

U.S. Budget Deficit

U.S. Budget Deficit Government spending increases despite President Trump’s promise to eliminate debt. Image: Financial Times

Federal Budget Deficit Since 1948

Federal Budget Deficit Since 1948 The federal budget deficit is unusually large compared to the state of the U.S. economy. Image: Goldman Sachs

U.S. Budget Deficits and the U.S. Dollar

U.S. Budget Deficits and the U.S. Dollar Pretty good correlation between U.S. budget deficits and the U.S. dollar over the past 30 years. The chart suggests that the U.S. dollar should weaken over time. You may also like “U.S. Twin Deficits (% of GDP) Lead Real Trade Weighted Dollar Index by Two Years” and “U.S. Dollar…

U.S. Twin Deficits (% of GDP) Lead the U.S. Dollar Broad REER by 18 Months

U.S. Twin Deficits (% of GDP) Lead the U.S. Dollar Broad REER by 18 Months The chart suggests that the U.S. dollar should weaken over time. You may also like “U.S. Twin Deficits (% of GDP) Lead Real Trade Weighted Dollar Index by Two Years” and “U.S. Dollar and Relative Growth (GDP Spread)” and “U.S. Budget…

The U.S. Federal Deficit

The U.S. Federal Deficit This chart shows how the U.S. federal deficit is skyrocketing. This is not a cause for panic… yet. Picture Source: Bianco Research