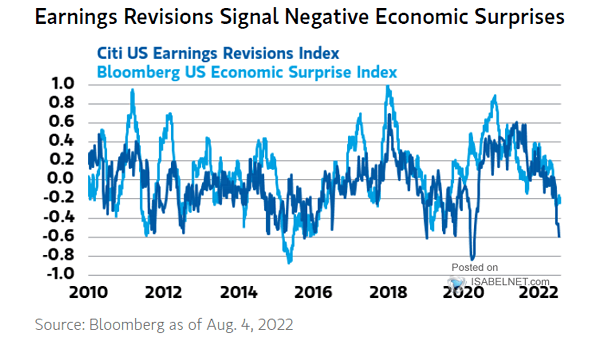
Citi U.S. Economic Surprise Index vs. S&P 500 Earnings Surprise
Citi U.S. Economic Surprise Index vs. S&P 500 12-Month Earnings Surprise U.S. earnings revisions suggest negative economic surprises. Image: Morgan Stanley Research
Citi U.S. Economic Surprise Index vs. S&P 500 12-Month Earnings Surprise U.S. earnings revisions suggest negative economic surprises. Image: Morgan Stanley Research
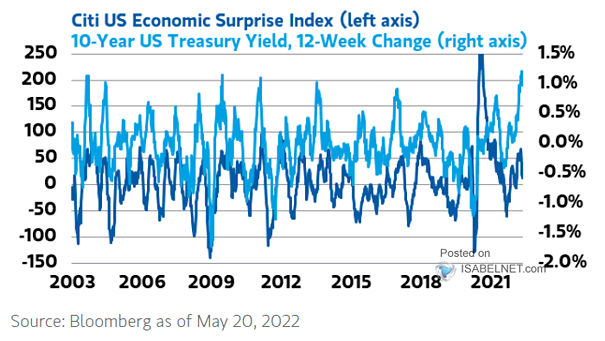
Citi U.S. Economic Surprise Index vs. 10-Year U.S. Treasury Yield Should investors expect U.S. Treasuries to rally? Image: Morgan Stanley Research

Inflation Surprise – Economic Surprise The risk of stagflation in the euro area is increasing significantly. Image: Gavekal, Macrobond
Percent of Time the S&P 500 Has Risen during Economic Expansions Economic expansions tend to be bullish for the S&P 500. Image: Truist
Economic Growth vs. M2 Velocity The decline in economic growth has coincided with a collapse in M2 velocity Image: Real Investment Advice
U.S. Debts, Deficits and Economic Growth The rise in the U.S. deficit and debt has coincided with declining economic growth rates. Image: Real Investment Advice
Global Economy – FMS Economic Expectations Has the global economy growth peaked? Image: BofA Global Fund Manager Survey
Economic Surprises Index – China vs. G10 Economies Will G10 economies follow China? Image: BCA Research
U.S. 10-Year Treasury Yield and Economic Surprise Index Should investors expect downward pressure on U.S. Treasury yields in the short-term? Image: Morgan Stanley Wealth Management
Economic Cycle – U.S. Economic Expansion Economic cycles of growth can last many years, with an average of more than five years. Image: LPL Research
U.S. Real GDP – Economic Booms and Buts U.S. real GDP booms at 33.1% rate in Q3 2020, one of the strongest on record. Image: CNBC