Sentiment – Net Bullish Ratio vs. S&P 500 Index

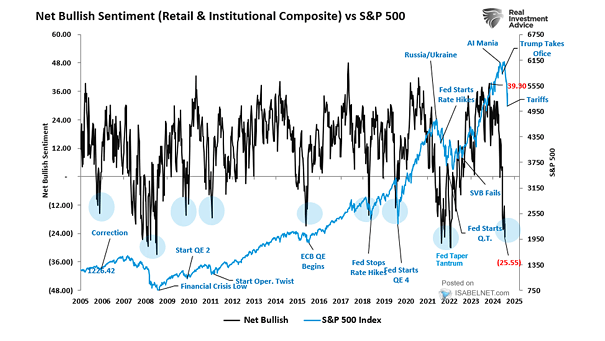
Net Bullish Sentiment vs. S&P 500 Index The net difference between bulls and bears indicates overall investor sentiment and suggests a temporary pullback within a bullish market trend. Image: Real Investment Advice
Sentiment – Global Risk Demand Index

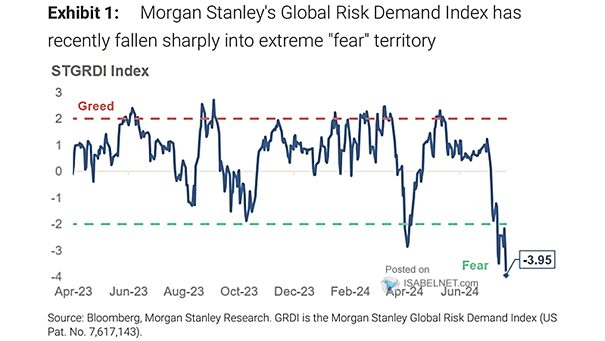
Sentiment – Global Risk Demand Index The Morgan Stanley Global Risk Demand Index indicates that investors’ risk appetite is very low, which can often be seen as a contrarian indicator, where extreme pessimism might signal a potential rebound in equity markets. Image: Morgan Stanley

Combined AAII & II Sentiment

Combined AAII & II Sentiment The combined sentiment of the American Association of Individual Investors (AAII) and Investors Intelligence (II) continues to be bullish, with bearish sentiment remaining notably low. Image: Topdown Charts

Market Sentiment – Levkovich Index

Market Sentiment – Levkovich Index The Levkovich Index, or Panic/Euphoria Model, is currently in a state of “euphoria”, indicating a high level of optimism among investors. Image: Yahoo Finance

Sentiment – Global PMI and Risk Appetite Indicator

Sentiment – Global PMI and Risk Appetite Indicator The GS risk appetite indicator remaining elevated suggests that investors have a high appetite for risk in the financial markets. Image: Goldman Sachs Global Investment Research

AAII Bullish Sentiment

AAII Bullish Sentiment Individual investor sentiment must improve significantly if the current uptrend in U.S. stock prices is more than just a typical bear market rally. Image: BofA Global Research

S&P 500 Following Sentiment Extremes

S&P 500 Following Sentiment Extremes The latest AAII U.S. investor sentiment bull – bear spread suggests promising S&P 500 returns over the next few months. Image: Richardson Wealth