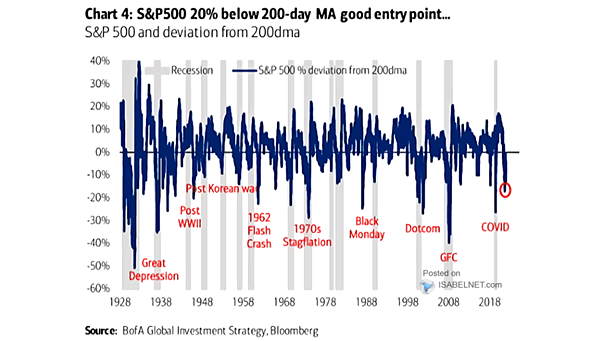
S&P 500 and Deviation from 200-Day Moving Average

S&P 500 and Deviation from 200-Day Moving Average Historically, a 20% drop below the 200-day moving average of the S&P 500 tends to be a good entry point for long-term investors. Image: BofA Global Investment Strategy
S&P 500 Index and 3-Year Moving Average

S&P 500 Index and 3-Year Moving Average The S&P 500 will likely break below its 3-year moving average, as recession fears mount. Image: BCA Research

Nasdaq and 200-Week Moving Average

Nasdaq and 200-Week Moving Average How deeply will the Nasdaq drop below its 200-week moving average? Image: BofA Global Investment Strategy