S&P 500 and Seasonal Rotation Strategy
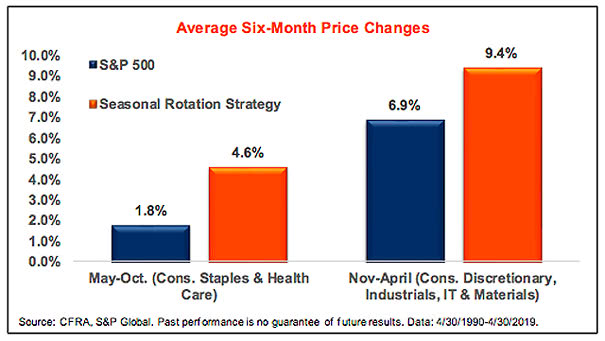
S&P 500 and Seasonal Rotation Strategy Sell in May and go away? This chart suggests that a rotation between defensive and cyclical sectors was a much better strategy Image: CFRA, S&P Global
S&P 500 and Seasonal Rotation Strategy Sell in May and go away? This chart suggests that a rotation between defensive and cyclical sectors was a much better strategy Image: CFRA, S&P Global
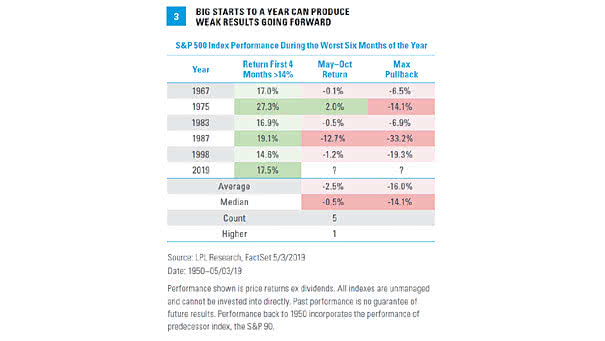
Big Starts to a Year Can Produce Weak Results Going Forward While new all-time highs and consecutive winning streaks can produce above-average returns in the longer term, pullbacks are possible in the short term. Our previous two articles: “Sell in May and Go Away?” and “Sell in May and Go Away? Maybe Not this Year“…

6-Month Returns for the S&P 500 Index from 1950 to 2018 The next 6 months have been the worst on average. Here is the 6-Month returns for the S&P 500 Index from 1950 to 2018. Our previous two articles: “Sell in May and Go Away?” and “Sell in May and Go Away? Maybe Not this…
VIX vs. S&P 500 The lack of a significant increase in the VIX during the market decline may indicate that widespread panic selling is absent. Image: Real Investment Advice
S&P 500 – Seasonality During Bull vs. Bear Markets The sell-in-May effect may be more relevant in bear markets. In bull markets, it may be seen as a missed opportunity for potential gains, given the positive momentum and upward trends typically observed in the market. Image: Topdown Charts
GWIM Flows to Debt The significant rate at which BofA’s private clients are selling debt may reflect a change in investment strategy. Image: BofA Global Investment Strategy
S&P 500 When Up 10% or More at the End of June The sell-off in U.S. stocks may not imply a long-lasting bearish period, but rather a temporary dip that could reverse in late October, as years with notable gains in the first half tend to bottom around that time. Image: Carson Investment Research
Investor Movement Index vs. S&P 500 The Investor Movement Index indicates the sentiment of TD Ameritrade retail investors. Thus, retail investors are net buyers of equities when the stock market is expensive, and they are net sellers of equities when the stock market is cheap. As usual, retail investors react to equity price movements. They buy and sell…
Privacy Policy Welcome to our Privacy Policy — Your privacy is important to us. ISABELNET S.A. is located at: 51 Cite Joseph Brebsom, L-4046 Esch-sur-Alzette, GRAND DUCHY OF LUXEMBOURG (LU) (Company Registration Number: B66007) It is ISABELNET’s policy to respect your privacy regarding any information we may collect while operating our website. This Privacy Policy…
Terms and Conditions of Use Welcome to ISABELNET These terms and conditions outline the rules and regulations for the use of ISABELNET’s website. ISABELNET S.A. is located at: 51 Cite Joseph Brebsom, L-4046 Esch-sur-Alzette, GRAND DUCHY OF LUXEMBOURG (LU) (Company Registration Number: B66007) By accessing this website we assume you accept these terms and conditions…