Coronavirus Crisis and Bankruptcies
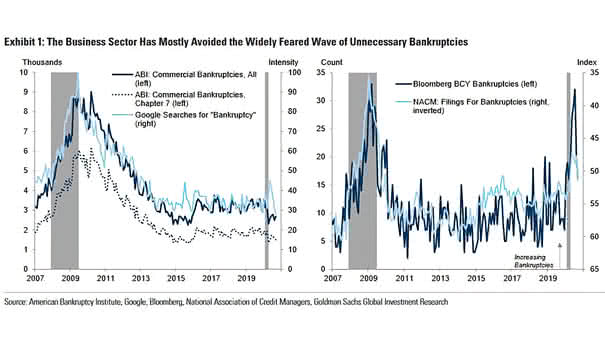
Coronavirus Crisis and Bankruptcies U.S. business bankruptcies are declining significantly. Image: Goldman Sachs Global Investment Research
Coronavirus Crisis and Bankruptcies U.S. business bankruptcies are declining significantly. Image: Goldman Sachs Global Investment Research
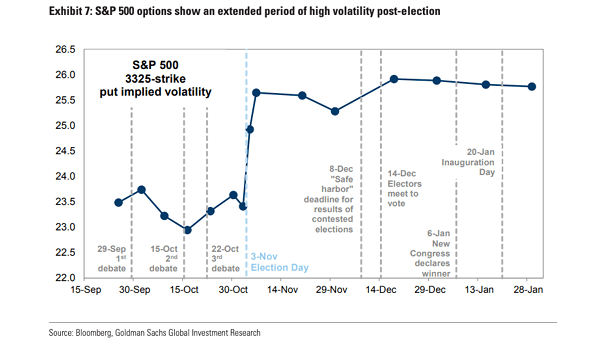
S&P 500 Options – S&P 500 3325-Strike Put Implied Volatility S&P 500 options reflect the possibility that the U.S. election results may be finalized with a delay. Image: Goldman Sachs Global Investment Research

Fed’s Balance Sheet Growth The growth of the Fed’s balance sheet has a good correlation with the S&P 500 since 2009. How will the U.S. stock market do the rest of the year? Image: Financial Times
Twin Deficits vs. Gold-to-S&P 500 Ratio U.S. twin deficits suggest that gold could outperform the S&P 500. Image: Crescat Capital LLC
Bubble – Wilshire 5000 to Nominal GDP Ratio The ratio of market capitalization to GDP is now higher than it was before the Internet bubble burst. Is the U.S. stock market on a bubble? Image: Statista
WTI Crude Oil vs. S&P 500 Energy Index U.S. energy stocks continue to trade at low levels relative to crude oil prices. Image: Morgan Stanley Wealth Management
Apple Market Capitalization vs. Russell 2000 This charts shows how big Apple is compared to U.S. small cap stocks. Image: Societe Generale Cross Asset Research
Bank to IG Index Spread Ratio and Bank to S&P 500 Ratio Are U.S. bank stocks a buying opportunity, despite Warren Buffett’s selloff? Image: Goldman Sachs Global Investment Research
Returns – S&P 500 Is on Pace for Its Fifth Consecutive Month of Gains Does the U.S. stock market rally have more legs, even though valuations are high? Image: Bloomberg
Fed Funds Futures Curve (Interest Rates) For the first time, traders are starting to price in negative U.S. interest rates for first time. Image: The Daily Shot