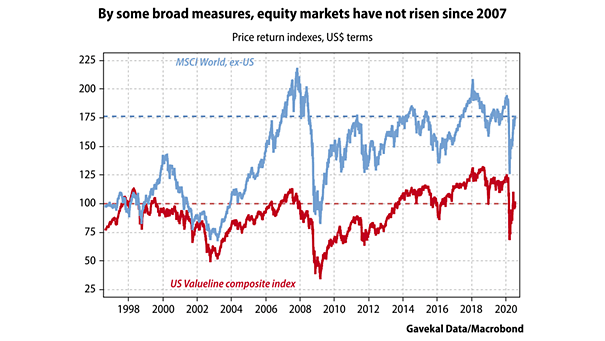
Emerging Markets Debt Yield

Emerging Markets Debt Yield The cost of servicing emerging markets debt denominated in U.S. dollars has fallen to almost 4%, thanks to global central bank liquidity and the weakening of the U.S. dollar. Image: Morgan Stanley Wealth Management

10-Year Real Yields Across Regions

10-Year Real Yields Across Regions This chart highlights the recent sharp decline of 10-year real yields in the U.S., the U.K. and Germany. Image: Goldman Sachs Global Investment Research

Valuation – Nasdaq 100 vs. S&P 500 Ratio

Valuation – Nasdaq 100 vs. S&P 500 Ratio The ratio of the Nasdaq 100 to the S&P 500 has only been higher in 2000, during the dotcom bubble. Image: U.S. Global Investors

Composition of Household Total Assets

Composition of Household Total Assets Chinese households are under invested in equities, with only 7% of total assets compared to 32% for U.S. households. Image: Goldman Sachs Global Investment Research

EU27 Nominal GDP vs. Nasdaq Market Capitalization

EU27 Nominal GDP vs. Nasdaq Market Capitalization Is tech in a bubble? The Nasdaq market capitalization is now bigger than the nominal GDP (in U.S. dollars) of the European Union’s 27 member countries. Image: Deutsche Bank