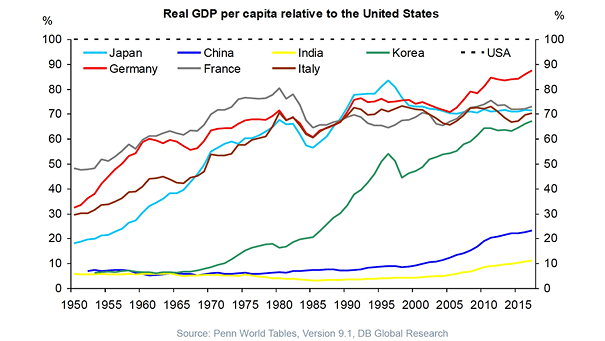
Real GDP per Capita Relative to the United States

Real GDP per Capita Relative to the United States China’s GDP per capita has increased significantly in recent decades. But relative to the U.S., it is still lagging. Image: Deutsche Bank Global Research
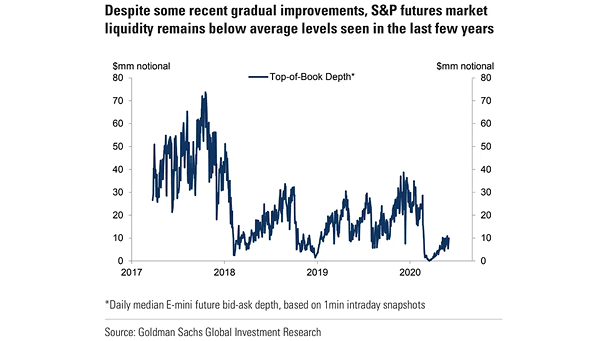
S&P 500 Futures Market Liquidity

S&P 500 Futures Market Liquidity Liquidity in U.S. equity collapsed in early 2018 and remains at low levels. Lack of liquidity tends to lead to violent market moves. Image: Goldman Sachs Global Investment Research

Unemployment Rate Forecast

Unemployment Rate Forecast Goldman Sachs expects the U.S. unemployment rate to reach 25% in Q2, a much higher peak than in other advanced economies. Image: Goldman Sachs Global Investment Research

Bankruptcies and Coronavirus Crisis

Bankruptcies and Coronavirus Crisis Filings for U.S. bankruptcies and Google searches for “Bankruptcy” are up. Image: Goldman Sachs Global Investment Research

S&P 500 vs. Bloomberg Consumer Comfort Index

S&P 500 vs. Bloomberg Consumer Comfort Index This chart highlights the wide divergence between the S&P 500 and the growing anxiety among Americans on the condition of the U.S. economy, their personal finances and the buying climate. Image: Lohman Econometrics

Inflation Assets vs. Deflation Assets

Inflation Assets vs. Deflation Assets The leadership remains deflationary, and the laggards remain inflationary. Deflation assets: government bonds, U.S. investment grade, S&P 500, U.S. consumer discretionary, growth and US high yield. Inflation assets: TIPS, EAFE, U.S. banks, value and cash. Image: BofA Global Investment Strategy

Alternative Measures of Consumer Activity

Alternative Measures of Consumer Activity Chart suggesting that activity is starting to pick up in the U.S., as lockdowns are easing after weeks of restrictions. Image: Goldman Sachs Global Investment Research