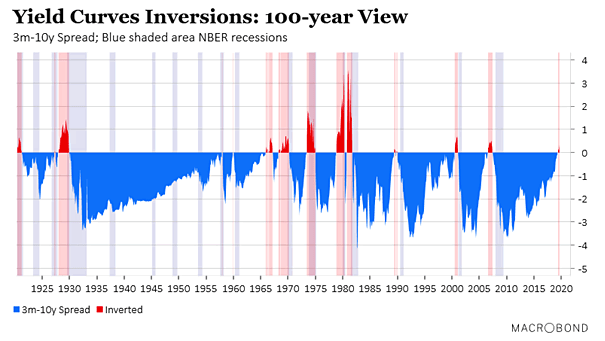
Yield Curves Inversions: 100-Year View

Yield Curves Inversions: 100-Year View This chart shows that over the past 100 years, some recessions have occurred without yield curve inversion. The yield curve is one recession indicator among many others. Image: Macrobond
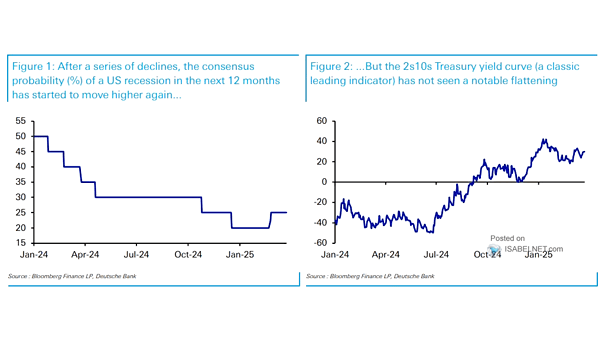
U.S. 2s10s Yield Curve and Recessions since 1941

U.S. 2s10s Yield Curve and Recessions since 1941 Since 1941, three recessions have occurred without 2s10s yield curve inversion. The yield curve is a great recession indicator among others. Image: Deutsche Bank

Allocation to Cash and Recession Probability

Allocation to Cash and Recession Probability This chart shows the correlation between allocation to cash and the NY Fed 12-month ahead recession probability indicator. Image: Barclays Research

Time from 2s-10s Yield Curve Inversion until Recession Starts

Time from 2s-10s Yield Curve Inversion until Recession Starts Recession tends to start in one to three years after the yield curve inversion. The yield curve is only one indicator among others of an economic puzzle. Image: Deutsche Bank Global Research

Citi Economic Surprise Index and S&P 500

Citi Economic Surprise Index and S&P 500 The Citi Economic Surprise Index has risen sharply, but it has an inconsistent history in terms of its correlation with the S&P 500. It is a cyclical indicator: high readings suggest favouring defensives over cyclicals, and low readings suggest favouring cyclicals over defensives. Image: Renaissance Macro

U.S. Recession With No Yield Curve Inversion

U.S. Recession With No Yield Curve Inversion Before 1960, five recessions occurred with no yield curve inversion. The yield curve is one recession indicator among many others. Image: Variant Perception Research

FedEx Stock Price Leads World Trade Volume by Three Months

FedEx Stock Price Leads World Trade Volume by Three Months This chart suggests that FedEx is usually a good leading indicator of the world economy. You may also like “FedEx vs. World Trade.” Image: Deutsche Bank Global Research