S&P 500 Performance After 20% Declines Since 1980

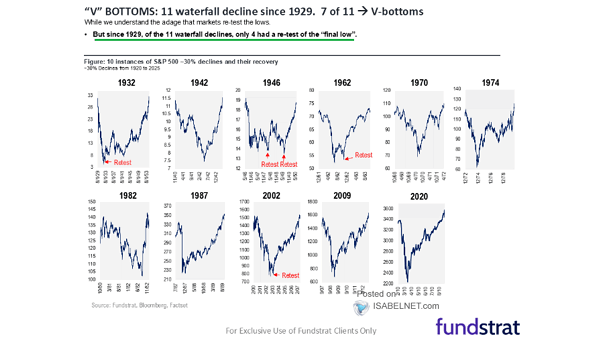
S&P 500 Performance After 20% Declines Since 1980 Goldman Sachs chief U.S. equity strategist, predicts that the S&P 500 will fall to 2,000 and rally to around 3,000 by the end the year. Image: Goldman Sachs Global Investment Research
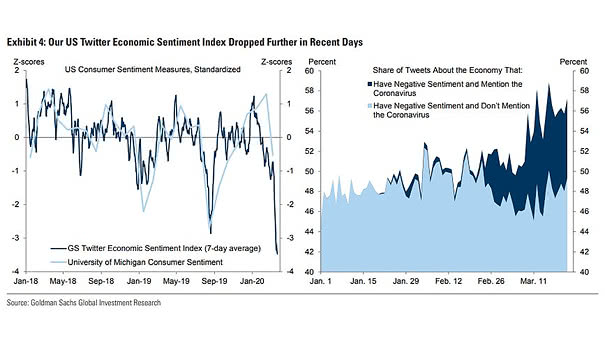
Twitter Economic Sentiment Index

Twitter Economic Sentiment Index The Goldman Sachs Twitter Economic Sentiment Index is extremely low and suggests that U.S. consumer sentiment appears to be deteriorating significantly. Image: Goldman Sachs Global Investment Research

Percent of Yield Curves Inverted

Percent of Yield Curves Inverted In recent history, U.S. recessions were preceded by yield curve inversion. It’s not different this time. Image: Macrobond Financial

Global Employment in S&P 500 Companies vs. Small Businesses

Global Employment in S&P 500 Companies vs. Small Businesses Small and medium-sized businesses play an important role in the U.S. economy, as S&P 500 companies employ only 17% of U.S. workers. Image: Deutsche Bank Global Markets Research

Liquidity and S&P 500

Liquidity and S&P 500 Liquidity in U.S. equity collapsed in early 2018 and remained at an extreme low. Lack of liquidity tends to lead to violent market moves. Image: Deutsche Bank Asset Allocation

S&P 500 Risk Parity Index

S&P 500 Risk Parity Index Risk parity funds experience their worst week since 2008, by the decline of U.S. Treasury bonds and equities. Image: Financial Times

Central Bank Target Rates

Central Bank Target Rates Who will be the next central bank to cut interest rates? Central banks have cut -3,147 basis points over the past year. Image: Arbor Research & Trading LLC