S&P 500 Next Twelve Months P/E vs. Dollar Index
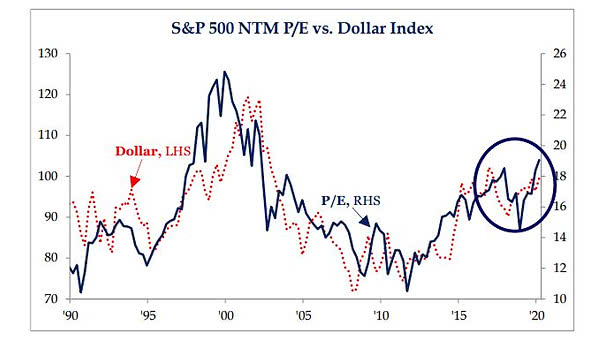
S&P 500 Next Twelve Months P/E vs. Dollar Index This chart suggests that the strength of the U.S. dollar supports higher P/E multiples for the S&P 500. Image: Strategas
S&P 500 Next Twelve Months P/E vs. Dollar Index This chart suggests that the strength of the U.S. dollar supports higher P/E multiples for the S&P 500. Image: Strategas
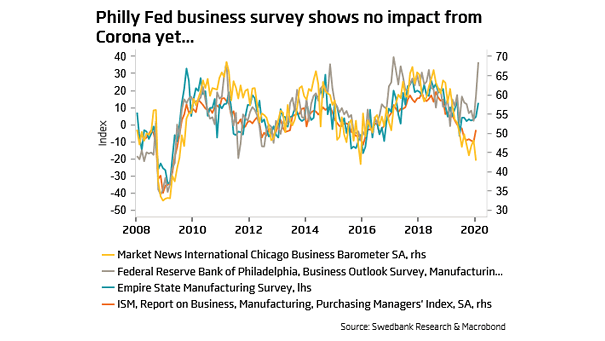
Philly Fed Manufacturing Index and Empire State Manufacturing Survey and ISM Manufacturing Index Despite the coronavirus, both regional PMIs suggest an increase in U.S. ISM manufacturing this month. Image: Swedbank Research

University of Michigan Stock Market Increase Probability Next Year and S&P 500 Drawdowns This chart suggests to remain vigilant on the U.S. stock market, when bullish sentiment is so high. Image: Bloomberg
Liquidity – Average Daily Trading Volumes U.S. treasuries are the most liquid class of assets, with an average of $485 billion a day in 2018. Image: howmuch.net
Earnings, Dividends and Valuation Chart showing the deviation of the S&P 500 Index against its trend line. The U.S. stock market needs earnings growth to rise this year. Image: Fidelity Investments
Valuation – S&P 500 vs. MSCI EAFE and MSCI Emergind Markets This chart highlights the valuation gap between U.S. and international equities. Image: LPL Research
Philly Fed Leading Index and Recession The Philly Fed Leading Index for the United States suggests that the U.S. economy is still in expansion mode over the next 6 months. Image: Federal Reserve Bank of Philadelphia
S&P 500 When ISM Manufacturing Index Rises Above 50 When the ISM Manufacturing Index rises above 50, U.S. Treasuries and the U.S. dollar tend to weaken, while the S&P 500 tends to rise. Image: Nordea and Macrobond
The SARS Analog – Virus Outbreaks and Global Markets The chart shows the SARS analog (2002 vs. 2020), highlighting the S&P 500 Index, the MSCI China Index, emerging markets vs. U.S. EPS and the CRB Raw Industrials Index. Image: Fidelity Investments
Chicago Fed National Financial Conditions Index and Recessions This indicator provides an update on U.S. financial conditions in money markets, debt, equity markets and the traditional & “shadow” banking systems. If financial conditions tighten sharply, this suggests a coming slowdown or recession.