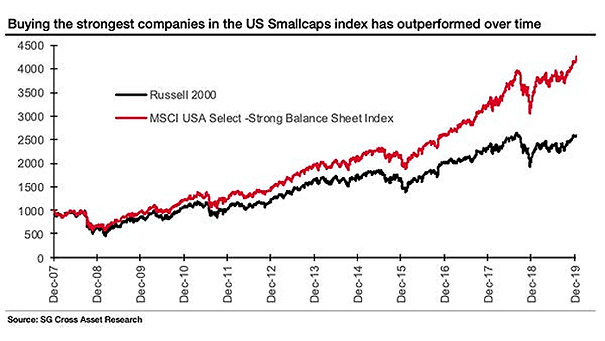
Inflation and S&P 500 6-Month Realised Volatility

Inflation and S&P 500 6-Month Realised Volatility Since 1987, the S&P 500 6-month realised volatility has been the lowest, when U.S. CPI growth has been in the 2 to 3 per cent range. Image: Societe Generale Cross Asset Research

Relative Performance MSCI Europe vs. MSCI USA

Relative Performance MSCI Europe vs. MSCI USA The relative performance of European stocks vs. the U.S. is at its lowest level in 50 years. Will this year be Europe’s time to outperform? Image: Legg Mason

Gold and Emerging Market Currency Index

Gold and Emerging Market Currency Index Historically, a weak U.S. dollar tends to be good for gold and emerging markets. Image: Gavekal, Macrobond

S&P 500 Valuation Metric

S&P 500 Valuation Metric Is the U.S. equity market overvalued? The S&P 500’s median valuation metric is in the 89th percentile. That’s not cheap by historical standards. Image: Goldman Sachs Global Investment Research

Real Interest Rates and Recessions

U.S. Real Interest Rates and Recessions Currently, U.S. real interest rates are negative. In recent history, real interest rates were at least above 1.8% (orange line) before a recession.