Global Valuation Map
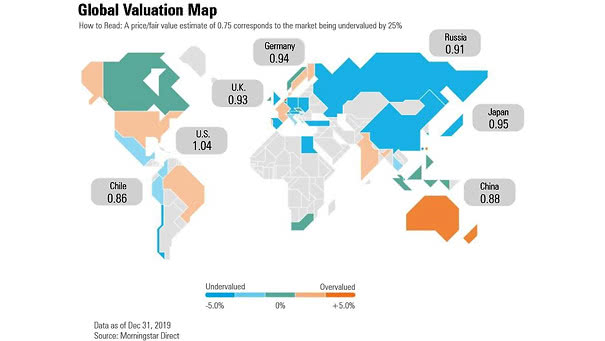
Global Valuation Map This chart shows global valuation estimates across various countries, and suggests that the U.S. stock market is overvalued by +4%. Image: Morningstar Research
Global Valuation Map This chart shows global valuation estimates across various countries, and suggests that the U.S. stock market is overvalued by +4%. Image: Morningstar Research
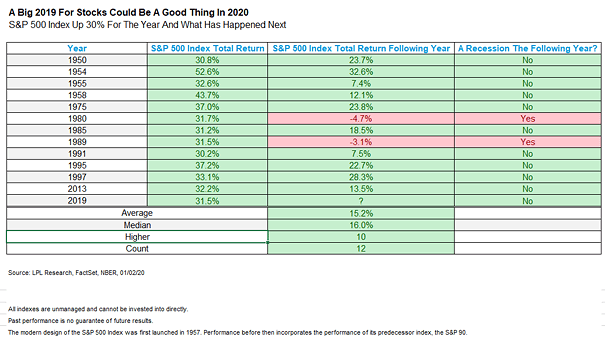
S&P 500 Total Returns in Years After 30%-plus Gains Since 1950, when the S&P 500 Total Return has been up more than 30%, it was up nearly 15% on average in the following year and the U.S. economy rarely has fallen into recession. Image: LPL Research

Truck Tonnage vs. Air and Rail Freight Trucks represent 70% of U.S. freight and serve as a barometer of the U.S. economy. This chart suggests that shipping has changed since the Great Financial Crisis, but is not deteriorating. Image: Arbor Research & Trading LLC
S&P 500 Net Debt vs. Share Buybacks U.S. companies are ramping up share buybacks. Funding is coming in part from a rise in debt. Image: Societe Generale Cross Asset Research
Inequality – Monthly Income After Tax Minus Average Monthly Expenditures Greatest economy ever? Despite increasing wage growth and a low unemployment rate, half of the U.S. population spends more than their income. Image: Deutsche Bank Global Research
S&P 500 Around Close Presidential Elections History also suggests that predictable elections are a non-event for the U.S. stock market. Image: Deutsche Bank Global Research
S&P 500 Index and Recessions Usually, the U.S. stock market isn’t this buoyant just before a recession. Image: Bloomberg
Share of Global GDP Today, U.S. GDP contributes 23.9% of the world’s economic output. In 1960, U.S. GDP was 40% of global GDP. Image: Jeroen Blokland
Domestic China Equities and Bonds Held by Overseas Investors Foreign holdings of Chinese equities rose to a record high this year, despite the U.S.-China trade war. Image: Bloomberg
Debt, Demographics and Labor Force Growth The slowdown in the labor force in the U.S., China, Europe and Japan, represents 62% of the world’s GDP and 69% of the equity market capitalization. The labor force growth is expected to be -1% by 2055. Image: Fidelity Investments