Fed Funds vs. Private Sector Wage Growth
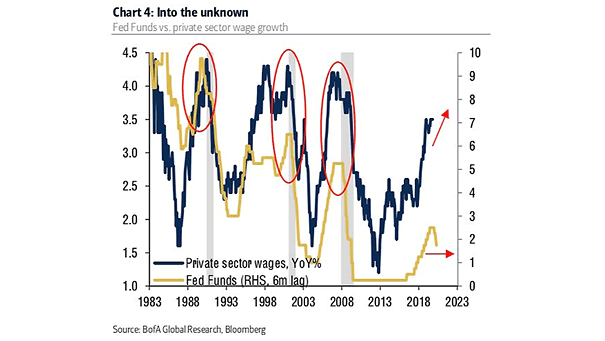
Fed Funds vs. Private Sector Wage Growth The last three U.S. economic expansions ended with the Federal Reserve hiking to curb wage growth, but not this time. That’s quite bullish. Image: BofA Global Research
Fed Funds vs. Private Sector Wage Growth The last three U.S. economic expansions ended with the Federal Reserve hiking to curb wage growth, but not this time. That’s quite bullish. Image: BofA Global Research
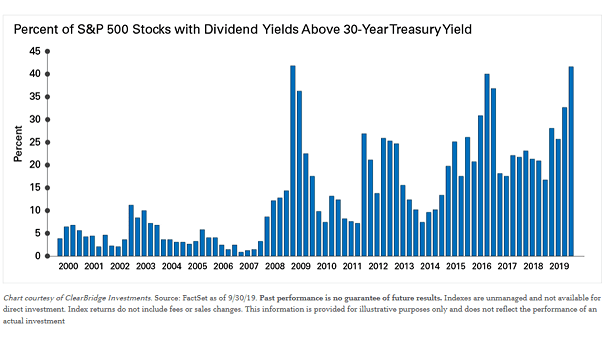
S&P 500 Stocks with Dividend Yields Above 30-Year Treasury Yield Yields on U.S. equities seem competitive vs. U.S. Treasuries, but equity risk does not disappear because a company pays a dividend. Image: Legg Mason

S&P 500 Average Returns Since 1926 Historically, in the year following a double-digit gain, there have only been three years where the U.S. stock market has experienced a double-digit decline. Image: Ben Carlson
Global Earnings Growth Chart showing that the gap between U.S. earnings growth and non-U.S. earnings growth is narrowing. Image: Fidelity Investments
Leading Economic Index (LEI) and Fed Funds Rate Will the Fed’s three rate cuts be enough to lift the U.S. economy? Image: Oxford Economics
MSCI Europe Relative to S&P 500 The relative range between the MSCI Europe Index and the S&P 500 has been broken since the European financial crisis. Since 2011, European equities have underperformed the U.S. at a -5.5% annual rate. Image: Deutsche Bank Global Research
Valuation – The Largest Stock in the S&P 500 At current level, Apple is the largest publicly traded U.S. stock. Image: Bianco Research
S&P 500 Returns, Deconstructed Chart showing that the U.S. stock market is back in its pre-2018 trendline. Image: Fidelity Investments
Chicago Fed National Financial Conditions Index and S&P 500 Financial conditions remain easy, which is historically bullish for U.S. equities. Image: BofA Global Research
Sharpe Ratio for the S&P 500 U.S. stocks have had the best decade since the 1950s. The sharpe ratio is a measure of risk-adjusted return. Image: Bloomberg