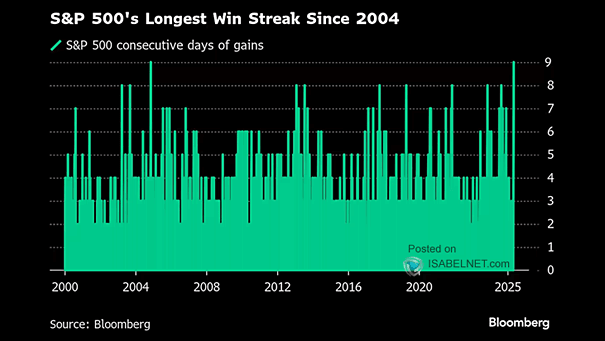
S&P 500 Annual Gains
S&P 500 Annual Gains The S&P 500 hits new record after U.S. and China strike deal to ease growing trade tensions. Image: Financial Times
S&P 500 Annual Gains The S&P 500 hits new record after U.S. and China strike deal to ease growing trade tensions. Image: Financial Times
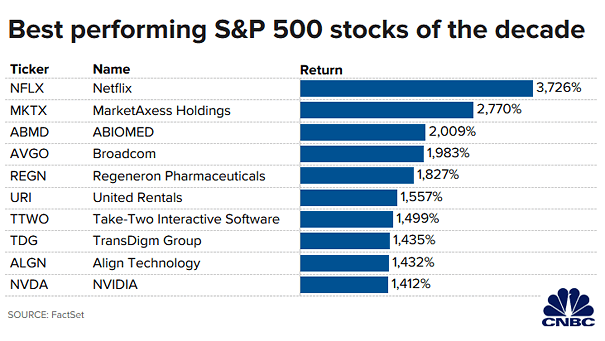
Best Performing S&P 500 Stocks of the Decade Netflix is by far the best performing U.S. stock of the decade. Image: CNBC

Annualized EPS Growth Across Major Global Equity Markets Goldman Sachs expects that EPS will modestly accelerate to 6% in the U.S. next year. Image: Goldman Sachs Global Investment Research
Starting Valuation Predicts Future Returns Based on the Shiller CAPE ratio, the chart suggests a 10-year compound annual growth rate of only 2% to 4% for the U.S. stock market. Image: Fidelity Investments
S&P 500 Index vs. MSCI EAFE Index Largely due to structural headwinds, international stocks have underperformed U.S. stocks significantly in this bull market, over the last ten years. It could continue next year as well. Image: LPL Research
S&P 500 and ISM Composite PMI At current levels, the U.S. market is pricing in a strong rebound in the ISM Composite PMI rising to 57. Image: Deutsche Bank Asset Allocation
Valuation – Apple Market Capitalization and S&P 500 Energy Apple is now worth more than the U.S. energy sector. Image: Financial Times
Historical S&P 500 December Returns December 2018 was the worst december for U.S. equities since the Great Depression. Image: Goldman Sachs Global Investment Research
Distribution of Monthly S&P 500 Returns Since 1928 December was an abnormally bad month for U.S. equities in 2018. Image: Goldman Sachs Global Investment Research
Distribution of Subsequent S&P 500 Returns From Different Levels of 12M Forward P/E Chart suggesting that equity returns can be strong, even though U.S. equities are currently expensive. Image: Goldman Sachs Global Investment Research