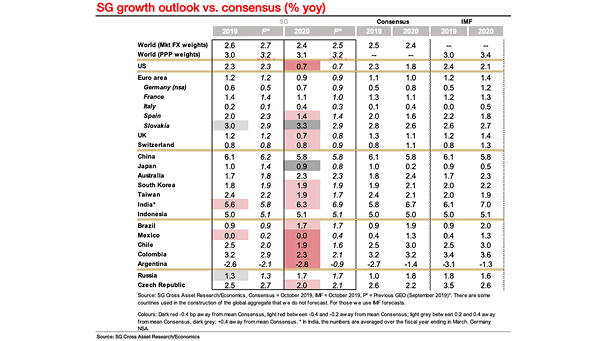
Global GDP Growth Outlook vs. Consensus
Global GDP Growth Outlook vs. Consensus SocGen remains below the consensus forecasts and expects a mild recession around mid-2020 in the U.S. and a projected U.S. GDP of 0.7%. Image: Societe Generale Cross Asset Research