Growth and Inflation
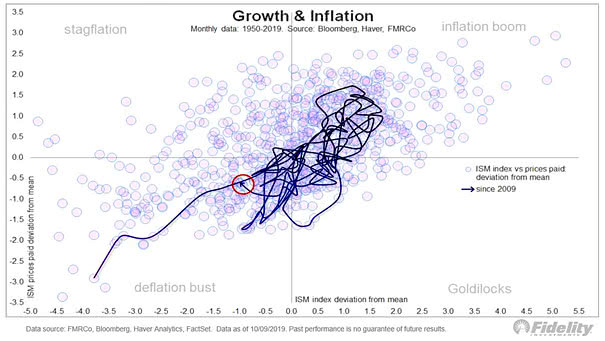
Growth and Inflation This chart shows the ISM Index vs. prices paid deviation from the mean since 2009. Currently, the U.S. manufacturing cycle has headed back into recession & deflation. Image: Fidelity Investments
Growth and Inflation This chart shows the ISM Index vs. prices paid deviation from the mean since 2009. Currently, the U.S. manufacturing cycle has headed back into recession & deflation. Image: Fidelity Investments
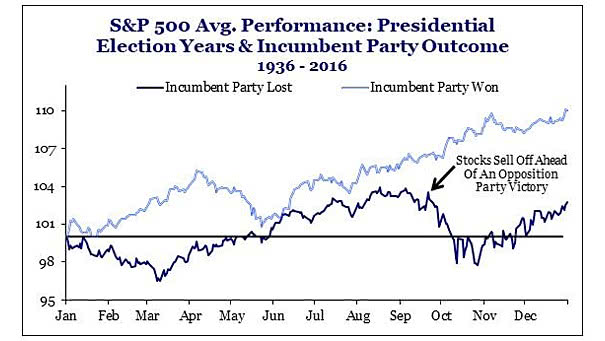
S&P 500 Average Performance – Presidential Election Years and Incumbent Party Outcome The S&P 500 performance 90 days before the U.S. Presidential election is very accurate in predicting the election winner. If the S&P 500 is up in the 90 days leading to election day, the incumbent party usually wins. This is true for 90%…

Copper to Gold Ratio The copper to gold ratio provides useful information on the evolution of the U.S. 10-year Treasury, the ISM Non-Manufacturing Index and the average weekly hours worked. Image: Paolo Cardena
Number of Days Between Cycle Turn and NBER Announcement The current U.S. business cycle is the longest on record. But what about the number of days between the cycle turn and the NBER announcement? Image: Lohman Econometrics
Conference Board CEO Business Confidence – Expectations for Economy 6 Months Ahead CEOs in the U.S. remain pessimistic about economic conditions. Outside of U.S. recession, CEO confidence has never been so low. Image: Pictet Asset Management
Earnings Estimate Progression The consensus growth estimate for Q3 earnings stands at -3.2%, but the earnings recovery seems better than 2016. The Fed’s dovish pivot and low interest rates should continue to support the U.S. stock market. Image: Fidelity Investments
Sentiment on Durable Goods Purchases Lead the Unemployment Rate This chart suggests that sentiment on durable goods purchases lead the unemployment rate by 12 months, and that the U.S. economy seems to be moving into the late phase of its business cycle. Image: Deutsche Bank Global Research
NFIB Expected Credit Conditions NFIB Expected Credit Conditions are improving and suggest that the U.S. expansion still has room to run. Source: Longview Economics
S&P 500 Total Return Change During Economic Expansions The current business cycle is the longest and weakest expansion. The next downturn could hit the U.S. stock market much harder than the economy. Image: Irrelevant Investor LLC
S&P 500 and Leading Economic Index (LEI) This chart shows that stimulus has saved the U.S. stock market each time. Saved once again? Image: Stifel