S&P 500 and Pre-Election Year
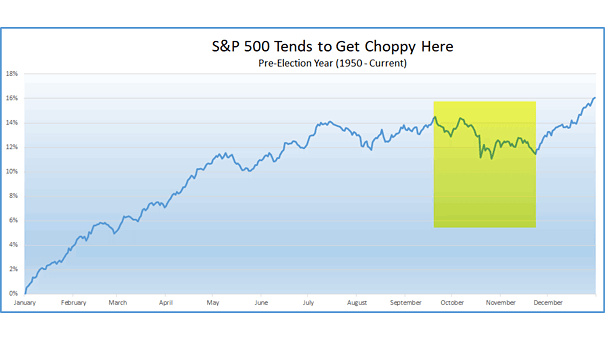
S&P 500 and Pre-Election Year In pre-election years since 1950, the chart suggests that the U.S. stock market doesn’t bottom until Thanksgiving. Image: Ryan Detrick, LPL Financial LLC
S&P 500 and Pre-Election Year In pre-election years since 1950, the chart suggests that the U.S. stock market doesn’t bottom until Thanksgiving. Image: Ryan Detrick, LPL Financial LLC
10Y-3M Treasury Yield Spread After First Rate Cut and Recessions After the first Fed rate cut, a steepening of the U.S. 10Y-3M yield spread could suggest a recession is coming. Image: Charles Schwab

Equity Market Tops Interesting chart showing equity market tops. The U.S. equity market hasn’t yet reached its peak. Image: DoubleLine
Imports of Saudi Arabian Crude Oil In 2018, the U.S. imported $21.9 billion of crude oil from Saudi Arabia. Image: The Washington Post
Market Capitalization of Listed Companies This nice visualization shows the U.S. stock market capitalization compared to the rest of the world. Image: howmuch.net
The World’s Biggest Oil Producers The U.S. is the first-largest producer of oil in the world, accounting for 16.2% of all production in 2018, and has surpassed Russia and Saudi Arabia. Image: Statista
War Scenario for the Oil Price A war between U.S./Saudi Arabia and Iran could lead to soaring oil prices and a global recession. Image: Danske Bank Research
Top Three Crude Oil Producers Chart showing that the U.S. is the world’s biggest oil producer and has surpassed Russia and Saudi Arabia. Image: Deutsche Bank Global Research
Fed’s Broad USD and Cyclicals vs. Defensives This chart suggests that current equity market rotation weakends the U.S. dollar. Image: Morgan Stanley Research
Correlation Between S&P 500 Index and MSCI EAFE Index Since 1997, the high correlation between U.S. and international equity markets suggests that the MSCI EAFE may only offer a slight risk/return benefit as a complement to a U.S. equity portfolio. Image: First Eagle Investment Management, LLC