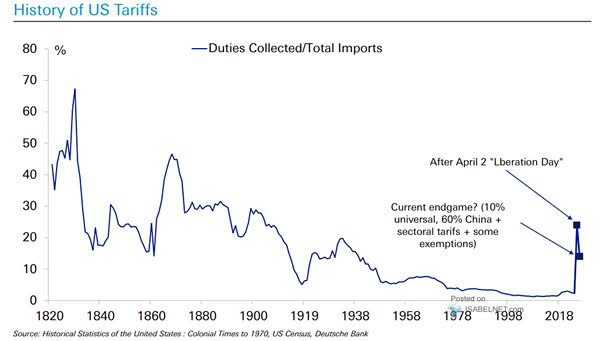
Tariffs in United States History
Tariffs in United States History A look at U.S. tariffs in the past and where they are today. You may also like “U.S. Effective Tariff Rate.” Image: Charles Schwab
Tariffs in United States History A look at U.S. tariffs in the past and where they are today. You may also like “U.S. Effective Tariff Rate.” Image: Charles Schwab
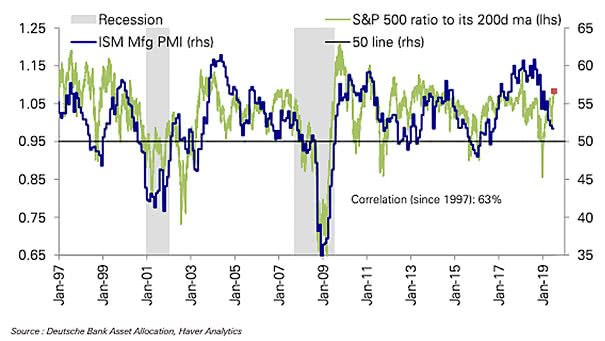
ISM Manufacturing Index vs. S&P 500 The U.S. stock market is pricing in a strong rebound in the ISM Manufacturing Index (R² = 0.40 since 1997). Image: Deutsche Bank

Stock Market Capitalization as a Percentage of Nominal GDP This ratio is useful in determining whether the U.S. stock market is undervalued or overvalued relative to its historical average. The current reading is pretty high at 149.15%. You may also like the “Stock Market Valuation” and “S&P 500 Index – Earnings & Valuation.” Image: Bianco Research
Homeownership Disparity Deepens Since 1994, the gap between blacks and whites has widened, in part because starter-home prices have exploded, year after year. Inequality: you may also like “U.S. Unemployment Rate: Black or African Americans” and “U.S. Net Worth by Wealth Bracket” and “Countries With the Highest Housing Bubble Risks.” Picture Source: Bloomberg
Global Nominal GDP After the U.S., China is the world’s second largest economy. Its nominal GDP represents 16% of world GDP, compared to 24% for the United States. Image: Scotiabank
Housing Usually Heats Up in the Summer This great chart shows that U.S. home sales usually heats up in the summer. Image: Leonard Kiefer
The Immigrant-Founded Fortune 500 Immigrants and their children have founded nearly half of all U.S. Fortune 500 companies. Image: Axios
Lower Incomes Paid the Highest Price Low-income groups are slowly recovering after the financial crisis. Inequality: you may also like “U.S. Net Worth by Wealth Bracket.” Image: Deutsche Bank Global Research
The Rise of Passive Investing Net inflows into index-tracking U.S. mutual funds and ETFs rose by around 50% in the second quarter from a year earlier. Image: The Wall Street Journal
Home Builder Sentiment Leads Consumer Spending Interesting chart suggesting that the NAHB housing market index leads the change in consumer spending. The latest reading for July suggests that the outlook for the U.S. economy is expected to slow. Image: Dr Thomas Kevin Swift