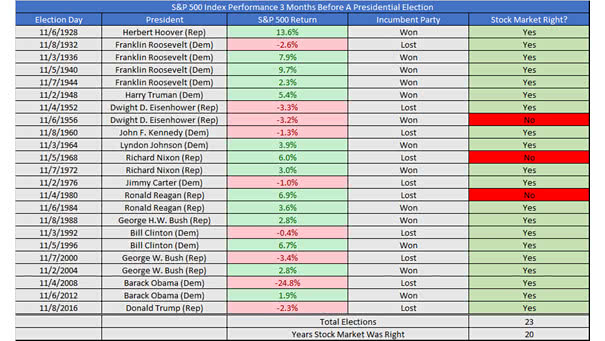
S&P 500 Index Performance 3-Months Before A Presidential Election
S&P 500 Index Performance 3-Months Before A Presidential Election The S&P 500 performance 3-months before the U.S. Presidential election is very accurate in predicting the election winner. You may also like “Unemployment and U.S. Presidential Elections.” Image: Ryan Detrick, LPL Financial LLC