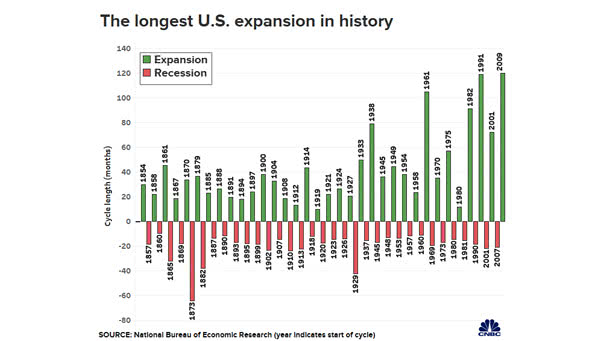
The Longest Economic Expansion in American History
The Longest Economic Expansion in American History The U.S. GDP has grown for 121 consecutive months since the Great Recession. This is officially the longest U.S. economic expansion in history. You may also like “Strength of Economic Expansions.” Image: CNBC